Debugging
Overview
The following sections explain how to debug FlexScript.
How It Works
Within the FlexSim code editor, there is a margin on the left side of the line numbers.
By clicking in the margin, you can add a breakpoint to that line of code. The breakpoint
will appear as a  in the margin. You can delete the breakpoint
by clicking the . When a line of code with a breakpoint is
executed, FlexSim will enter debug mode. While debugging, you will only be able to interact
with certain areas of the program including the debugger tools the tree window, output
consoles and a limited number of other windows. The code window will change to give you
tools for debugging.
in the margin. You can delete the breakpoint
by clicking the . When a line of code with a breakpoint is
executed, FlexSim will enter debug mode. While debugging, you will only be able to interact
with certain areas of the program including the debugger tools the tree window, output
consoles and a limited number of other windows. The code window will change to give you
tools for debugging.
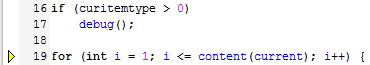
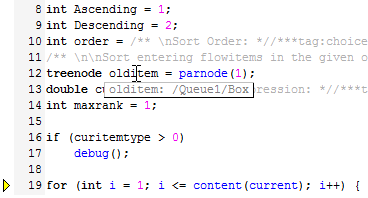
The debug() Command
The debug() command can be placed in any flexscript code. It acts just like
a breakpoint; it will pause the model and open the debug window when it is executed.
However, it will pause the model even when breakpoint debugging
is disabled.
This command makes it possible to have conditional breakpoints.
Controls

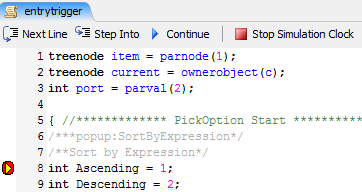
It has the following controls:
- Next Line - The yellow arrow shows you what line will be executed next. By pushing the Next Line button, that line will be executed and the yellow arrow will move to the next line of code to be executed.
- Step Into - This button can be used when a line of code contains certain function calls. It allows you to follow the code execution into the function and proceed line by line. When the function is finished, the debugger will return to the code that called the function. The only functions you can follow in this way are nodefunction, executefsnode, and any custom user commands.
- Continue - This will cause the FlexScript execution to continue until it reaches another breakpoint. If the code currently being executed finishes, then it will leave debug mode.
- Stop Simulation Clock - This button will stop the model's simulation clock. This is particularly useful if the model is running quickly, as the Continue button may cause FlexSim to re-enter debug mode almost instantly when it continues.
Breakpoints
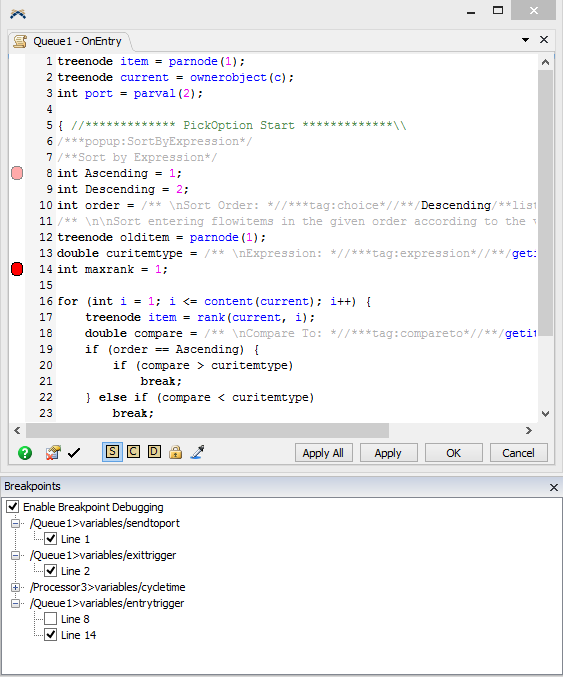
The Breakpoints window is available through the Debug menu. It is a treeview with
checkboxes showing you what breakpoints have been added to code in the model. You can
disable breakpoints by clicking the checkbox next to the line number where they are. You can
disable all the breakpoints by unchecking the "Enable Breakpoint Debugging" box. Checking
and unchecking these boxes will only affect whether a breakpoint is enabled or disabled, it
will not actually delete the breakpoint. To delete a breakpoint, you can highlight it in
this window and press the delete key or click on its in the
code window. Disabled breakpoints will appear as a ![]() in
the margin and will not cause the FlexScript execution to stop for debugging.
in
the margin and will not cause the FlexScript execution to stop for debugging.
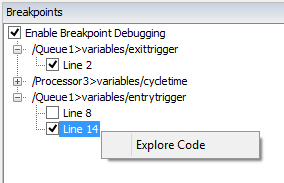
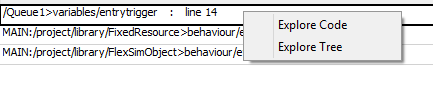
You may right click on a breakpoint in the breakpoints window to explore the associated code.
Local Variables
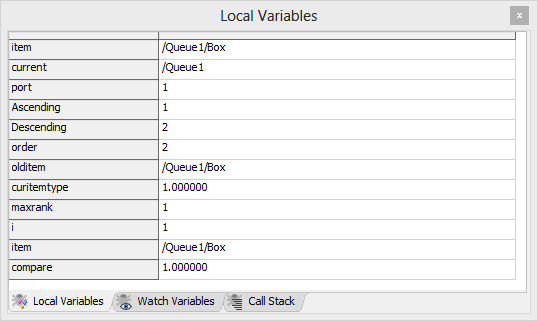
This area shows you the current values of any locally defined variables. As you step through the code, these values will update immediately so you can see what is happening. Often, models may not behave correctly because variables in code are not what they are expected to be. This window allows you to see exactly what the variables are.
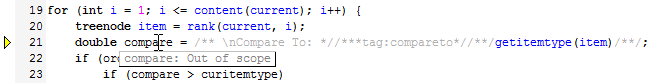
Alternatively, you can mouse over variables in the Code Edit window to see their current value.
Watch Variables
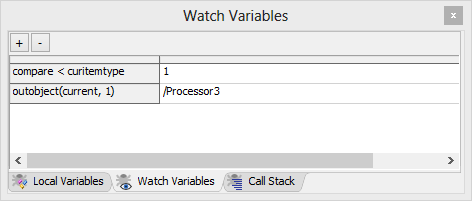
This area allows you to specify other variables or expressions that you want to see, such as global variables. By pushing the + button, you can increase the number of lines in the table. The - button will delete the row that was last clicked in the table. You can double-click on a gray area of the table to enter a variable or expression. Its value will be displayed to the right. This can help explain why certain conditional statements, such as used in "if" statements aren't behaving as expected. It also allows you to see global variables that otherwise are not visible on the Local Variables tab.
Call Stack
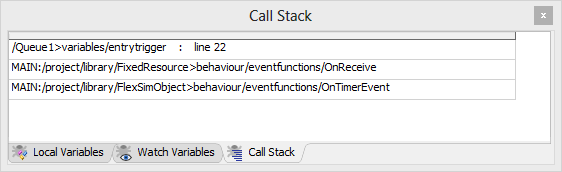
This area shows the current call stack, which is a function call history. The most recent call is always at the top of the list. In this case, the OnEntry function was called by the OnRecieve function, which was called by the OnTimerEvent function.
You may right click on any line of the call stack to explore the associated code or node in the tree.
Code Profiler
The Code Profile window profiles all the flexscript code being executed in your model.
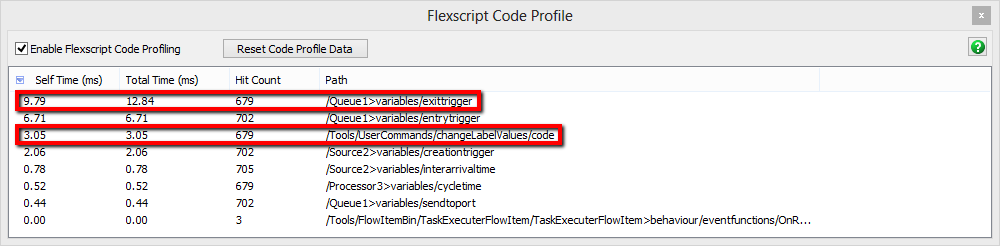
It has the following properties:
Enable Flexscript Code Profiling
Check this box to enable Code Profiling. Code profiling will remain enabled even if the Code Profile window is closed.
Reset Code Profile Data
Clears the currently accumulated profile data.
Self Time (ms)
This is the total amount of time in milliseconds that the code has taken to execute since the model began.
Total Time (ms)
This is the Self Time plus any time spent calling other functions like User Commands within the code.
Hit Count
This is the total number of times the code has been executed.
Path
The path to the flexscript node being executed.
Event List and Event Log
The Event List and Event Log tools are also helpful for debugging. See Event List and Event Log for more information about these tools.