Tutorial Task 2.2 - Build an Output Collector
Task Overview
In this tutorial you will create a Statistics Collector that record the output of the Stations. This tutorial is based on the same model that was used in the Tutorial 1 of this series. For information on how to load the model, please refer to that tutorial:
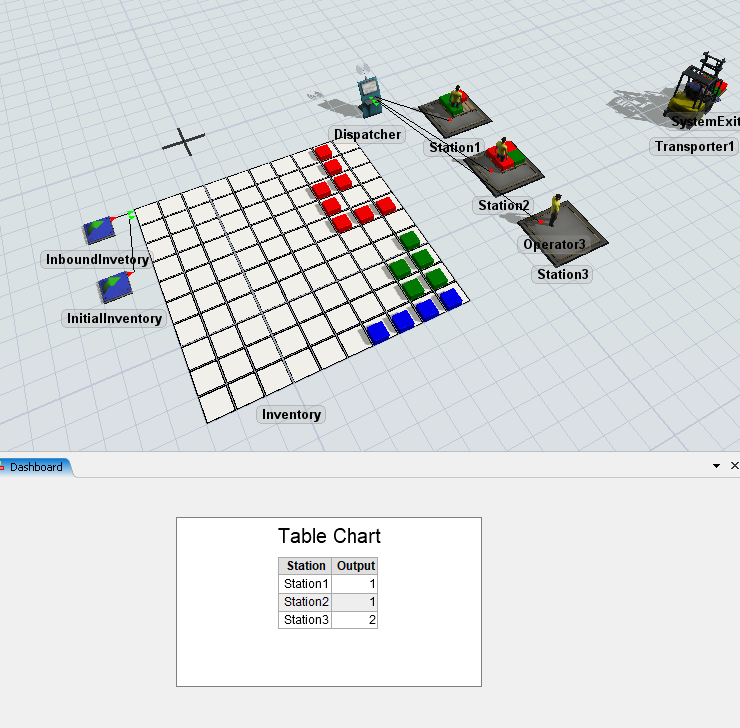
After following this tutorial, you should have a new Statistic Collector and chart that looks like the following.
Step 1 Setting up the Statistics Collector
In this step you will create and setup a new statistics collector. To do this:
- Navigate to the Toolbox tab on the left side of the screen.
- Click the
 button to create a new tool. Go to the Statistics
selection, and select the Statistics Collector option. It should
open a new properties window for the new statistics collector.
button to create a new tool. Go to the Statistics
selection, and select the Statistics Collector option. It should
open a new properties window for the new statistics collector. - Click the top field of the properties window, and rename the statistics collector to StationOutput
- In the Events tab, click
the
 sampler button, and then click on Station1 in the 3D view.
Point to the Stations option, and then choose On Output Change.
sampler button, and then click on Station1 in the 3D view.
Point to the Stations option, and then choose On Output Change.
- In the properties window, click the triangle next to the Row Value(s) and choose Event object (current).
- Navigate to the Columns tab in the properties window and click the
button to add a new column to the StationOutput
collector’s table.
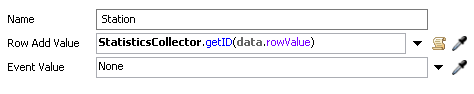
- Click on the Name box and rename the column to be Station.
- Next to the Row Add Value box select the arrow to open the picklist options. Select the IDs category and select the ID of Row Value option.
- Click on the button again to add a new column.
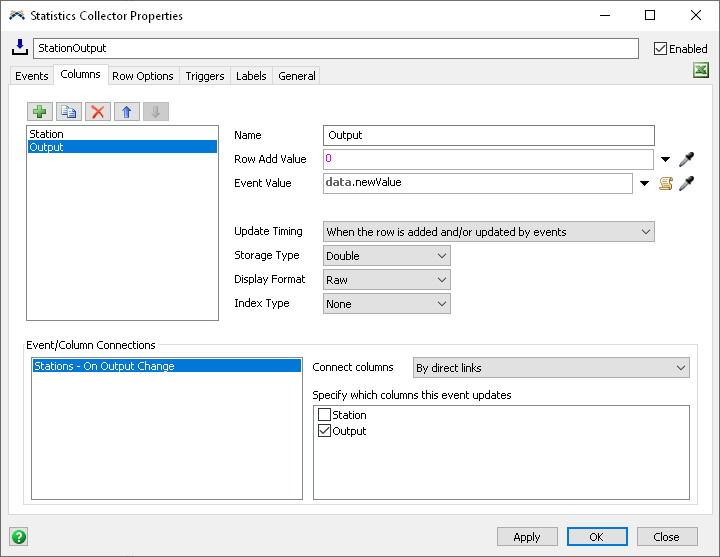
- Click on the Name box and rename this column to Output
- Click on the Row Add Value box, and type
0. In this case we want the value for the Output to be0when the Row is added, but we will get the actual output of the station in the Event Value box. - Click on the Event Value box and type
data.newValue. - To make the Column/Event connection, Click on the Stations - On Output Change option in the Event/Column Connections field, and then check the Output box in the field where it says Specify which columns this event updates
- Finally we can click on the Storage Type field and select the Integer option.
- Click the Apply button.
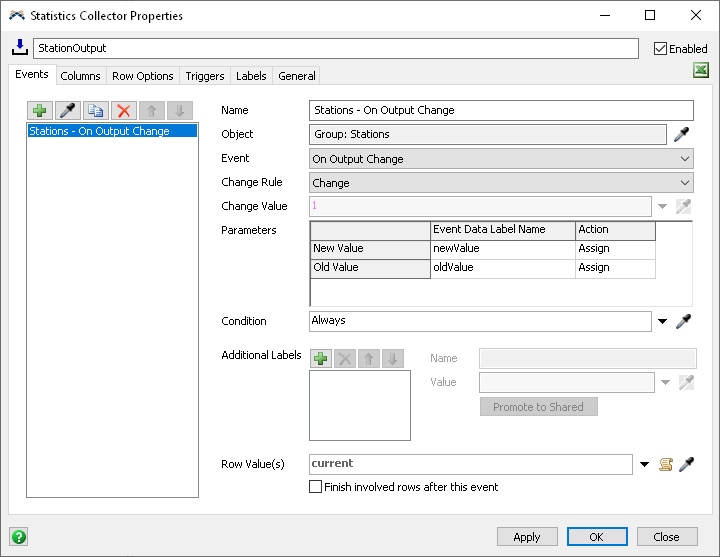
This will use the label that was created on the On Output Change event parameters, which looks at what the new value for the event is when it fires. In this case, it is the station’s output.
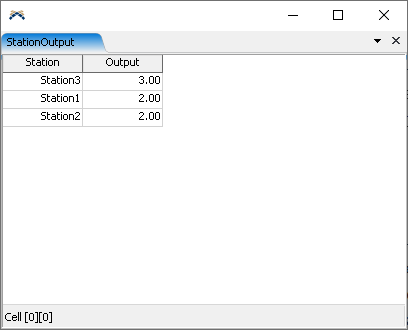
Reset and run the model. If you right click on the StationOutput collector object in your Toolbox tab, and select View Table, you will be able to see the statistic collector’s table update for each station.
Explanation
Listening to a Group
The statistics collector can listen to a group of objects. If any of the objects in the group fire the event, the statistics collector will respond to that event. In this task, you listened to the On Output Change event of all the objects in the Stations group. This means that if any Station fires its On Output Change event, then the statistics collector will respond.
Event Parameters
When you listen to an object event, that event may have parameters.
In this example, you listened to the On Output Change event,
which has two parameters: the new and old values of the output statistic.
These parameters are assigned as labels on the data
entity. In this task, you used data.newValue in the
value of the Output column. newValue is a parameter
of the On Output Change event, and is assigned a label
on the data object.
Using current
In the statistics collector, the keyword current refers
to the object that fired the event. When any of the stations
fire their On Output Change event, current will
refer to the station that fired the event.
Connecting Events and Columns
You can connect an event to one or more columns. When the event fires and yields its row value, then the statistics collector will make sure there is a row for that value. Then, for each connected column, the statistics collector will record the Event Value for that column on the current row. In this task, you connected the On Output Change event to the Output column. When a station's output changes, the statistics collector will make sure there is a row for that station, and then it will write the new output value in the Output column.
Storage Types
The statistics collector allows you to control how much memory is required per column. In this task, you set the Storage Type to Integer. This means that the field will only be able to store integer values, but it will require less memory than a Double column.
Step 2 Setting the Display Order of the Stations
Right now, the statistics collector adds a row for each station when its output changes for the first time. This means the order of rows in the table depends on how the model runs.
To fix this:
- Navigate again to the Statistic Collector’s properties window, and go to the Events tab.
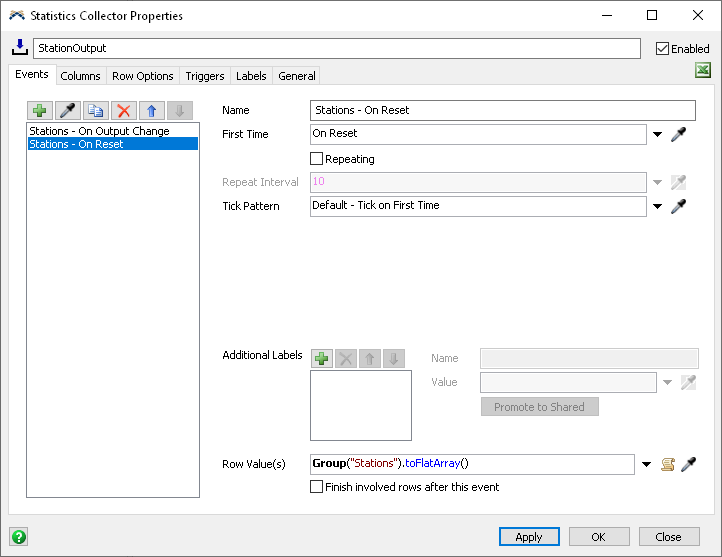
- Click the button to add a new event, and
select the Create an event on reset option.
- Click on the Name box and rename the event to Stations - On Reset
- Click on arrow next to the Row Value(s) box, then select the All Members of a Group option, and then select the Stations group.
- Click the Apply button.
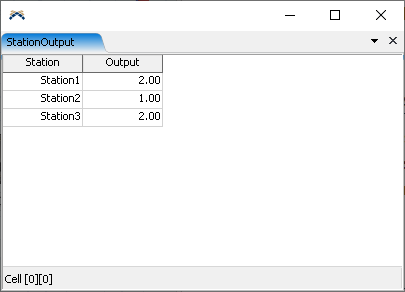
If you reset and run the model now, you can view the table and should now see that the StationOutput collector's table has ordered the stations correctly.
Explanation
When the Stations - On Reset event fires, it yields an array containing all objects in the Stations group. These objects are in the order shown in the Group properties window. Later, when the Stations - On Output Change event fires, there is already a row for the station, so the Statistics Collector doesn't add a new row. However, that event is connected to the Output column, so the Output column on the station's row is updated.
Step 3 Adding a Table Chart to the Dashboard
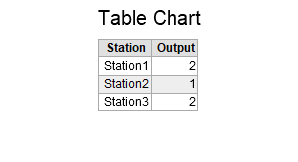
Next we will add a simple table chart to display the output in the dashboard. When finished the table should look something like this.
To create the chart:
- Click the Dashboards button at the top of the screen, and select the Add a Dashboard option.
- In the Properties on the right, click on the box Dashboard Name. Rename the Dashboard to be StationOutput.
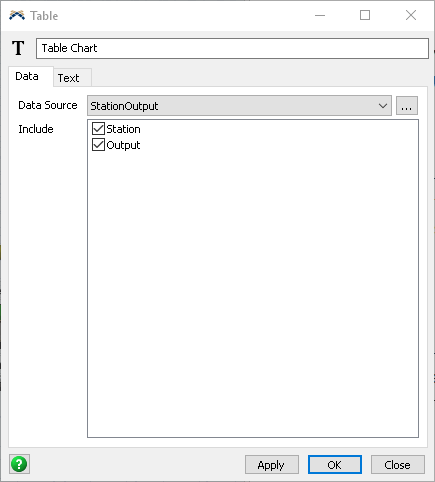
- While the Dashboard view is active, navigate to the library on the left. Find the option Table Chart under the Base Chart Types category, and drag a table chart into the dashboard window. This will create a new blank chart, and open its properties window
- In the properties window, click on the Data Source field, and select the StationOutput collector from the options.
- In the Include field, make sure the Station and the Output boxes are checked.
If you reset and run the model you can now see that the table chart will track the station output. You may need to run the model at a higher speed to see this happen.
In the next task we will use the Statistics Collector to display the stations content over time.