Task 2.4 - Orders By Size Statistics Collector
Task Overview
In this tutorial you will again use the statistics collector to gather statistics that would not be gathered in the default settings of the model. In this case, you will get statistics on the number of orders processed but broken out based on the number of items in each order. You’ll have statistics on the throughput of orders based on size. You will do this by utilizing labels from within the statistics collector events.
This tutorial is based on the same model that was used in the Tutorial 1 of this series. For information on how to load the model, please refer to that tutorial:
Step 1 Setting up the Statistics Collector
To set up the statistics collector:
- Click on the Toolbox tab on the left of the screen and click the
 button to add a
new tool. Navigate to the Statistics section and select Statistics Collector. This will
open a properties window.
button to add a
new tool. Navigate to the Statistics section and select Statistics Collector. This will
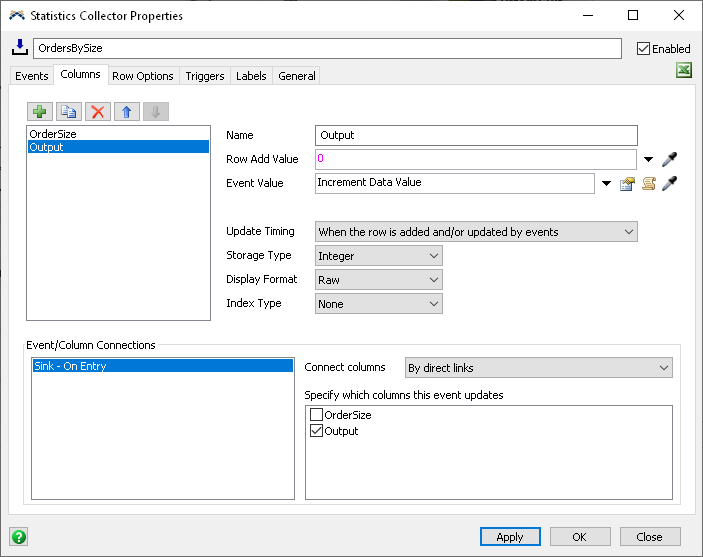
open a properties window. - Click on the field at the top and rename the statistics collector to OrdersBySize.
- Open the Process Flow view if it isn’t open already. (To do this, click on the Process Flow button at the top, and select the General directory and then select Process Flow.)
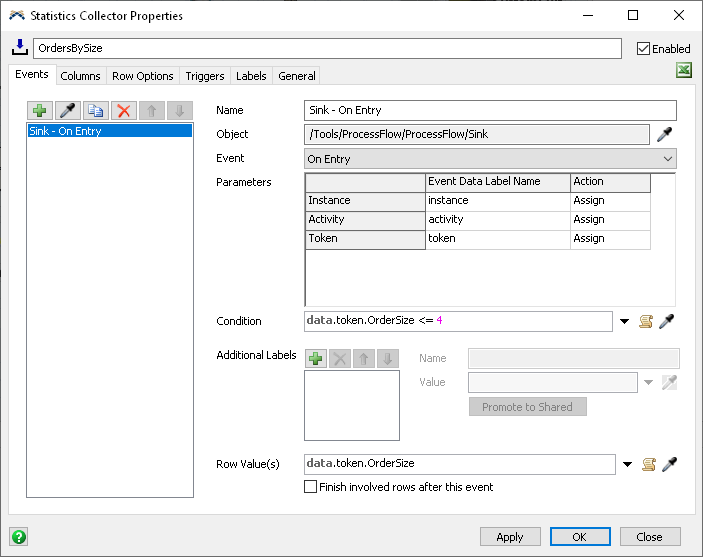
- Back in the statistics collector properties window, click on the
 Sampler button to
sample for a new event. With the sampler active, navigate to the Process Flow window and
click on the Sink activity. From the menu that opens, select the On Entry event.
Sampler button to
sample for a new event. With the sampler active, navigate to the Process Flow window and
click on the Sink activity. From the menu that opens, select the On Entry event. - In the Row Value(s) field type data.token.OrderSize. This will use the previously mentioned OrderSize label on the token and create a unique row for each different size of order that comes through.
- Click on the Condition field and type data.token.OrderSize <= 4.
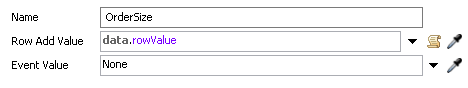
- Now click on the Columns tab, and click the button to create a new column.
- In the Name field, name this column OrderSize.
- In the Row Add Value field type data.rowValue.
- Click the Storage Type field and select the Integer option.
- Click the button to add another column.
- Name this column Output
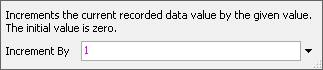
- In the Row Add Value field type
0. Because you want the Output value to start at 0 at the beginning. - Click the arrow next to the Event Value field and select the Data option and the Increment Data Value option.
- In the sub window field that opens, the default increment value should be
1, if it is not make sure it is1before closing it. - In the Event/Column Connections field, select the Sink - On Entry event, then check the Output box in the field that says Specify which columns this event updates.
- Click on the Storage Type field and select the Integer option.
- Click the Apply Button.
One thing to note in the process flow is the Set Order Size activity. Here you can see that there is a label, OrderSize, being set on the order tokens. You will use this label in the statistics collector as part of the data.
Additionally, imagine that you only want data on order sizes that are considered “small.” This is where you can use the Condition field to filter out some results from the Row Value. For the sake of this tutorial you are only looking for orders with a size of 4 or less.
Now if you right-click on the OrdersBySize collector in the Toolbox and select the View Table option you can see the table for the collector. You should be able to now see the table populate with the data on output based on order size. You may have to speed up the model runtime to see the changes.
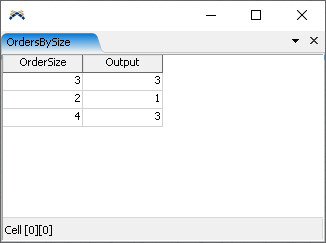
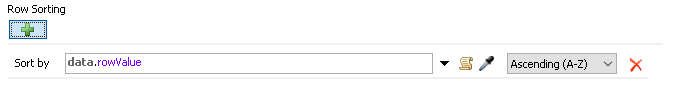
You may notice that the table is not ordered. The first row that comes in will be based on the first order that enters the system. If you want to order the table by order size, you can use the Row Sorting feature in the statistics collector properties. To do this:
- In the statistics collector properties window, click on the Row Options tab.
- Click on the + button underneath Row Sorting.
- This will create a new field. By default the Sort By field should say data.rowValue, if it does not, enter that now.
- Click the Apply button.
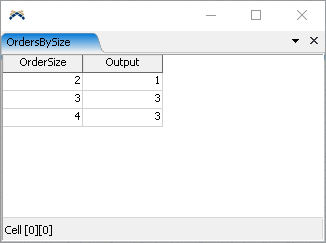
Once again if you reset and run the model, you should now see that statistics collector table will be sorted by order size now.
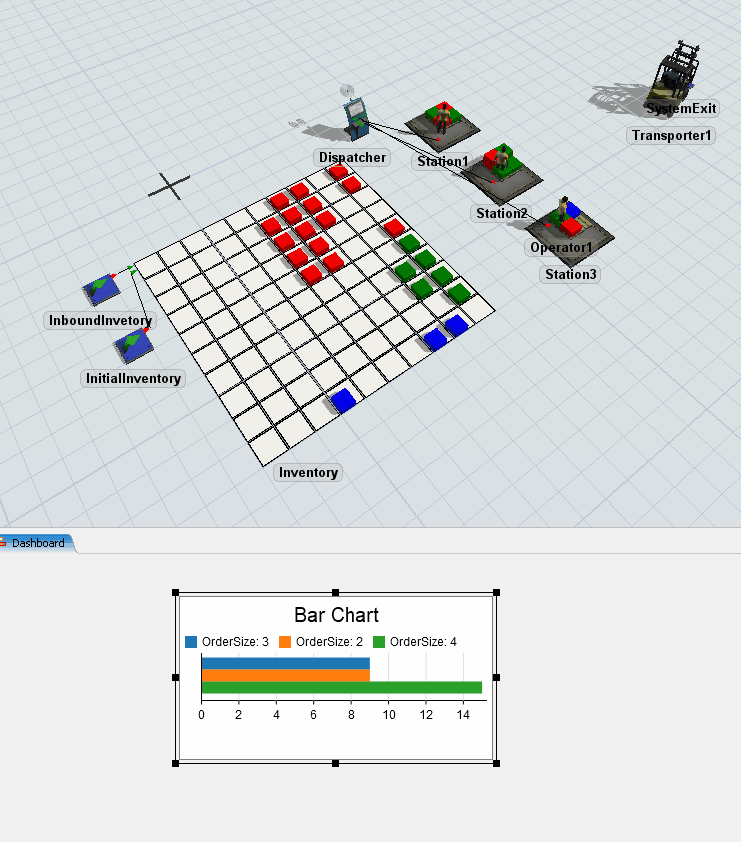
Step 2 Creating a Chart
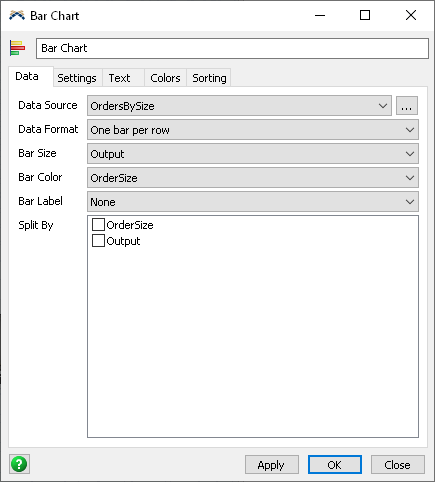
Now you will add a chart to chart the data collected by the OrdersBySize collector. To do this:
- First click the Dashboards button at the top of the screen and select the Add a Dashboard option.
- In the Properties on the right, click on the field Dashboard Name. Rename the dashboard to be OrdersBySize.
- While the dashboard view is active, navigate to the library on the left. Under the Base Chart Types section, find and drag a Bar Chart onto the dashboard. This will open the new chart’s properties window.
- Click on the Data Source field and select the OrdersBySize collector from the options.
- Click on the Data Format field and select the One bar per row option.
- Click on the Bar Color field and select OrderSize.
- Click on the Bar Size field and select Output
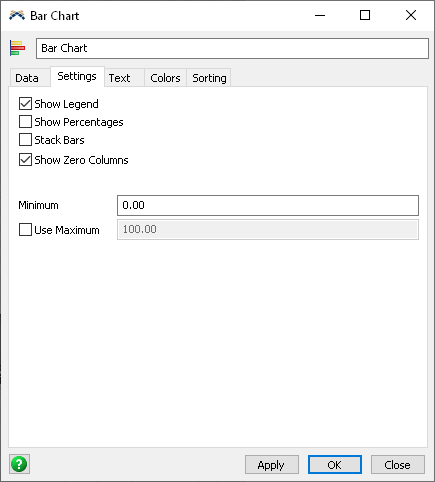
- Click on the Settings tab.
- Uncheck the Show Percentages box.
- Check the Show Zero Columns box.
- Click on the Text tab.
- Check the OrderSize box in the Show Column Headers field to make sure the OrderSize text is visible.
- Click the Apply button.
Now if you reset and run the model you will be able to see the chart utilizing the OrderBySize collector’s data during the runtime of the model.