The Advanced Panel
The Advanced panel contains advanced options for Chart Templates.
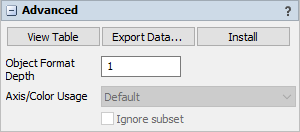
The following properties are on the Advanced panel:
View Table
Opens a view of the data being drawn by the chart. This is usually the Statistics Collector table. However, if the template uses a Calculated Table, this button will open the Calculated Table's table view.
Export Data...
Exports the data being drawn by the chart to CSV. This is usually the data gathered by the Statistics Collector. However, if the template uses a Calculated Table, this button will open the Calculated Table's table view.
Install
Installs the chart template. All internal tools (Statistics Collectors, Calculated Tables, Process Flows, and/ or Groups) are moved to the toolbox, and the chart template itself is destroyed.
Object Format Depth
Edits how many parts of an object's path are displayed for object formatting. Enter 0 to show the full path.
Axis/Color Usage
Specifies how to visualize subsets and partitions. Only Chart Templates that rely on the Query Builder have this property. If this property is available, there are four possible options:
- Use colors only - All category values, whether the category is a Subset or Partition, will be represented using color.
- Use axis for subsets, use colors for partitions - Subsets will appear as separate axis values. Partitions will be represented with color.
- Use color for subsets, use colors for partitions - Subsets will appear as separate colors. Partitions will appear on separate axes.
- Use axis and color for subsets, use color for partitions - Subsets will be represented both by color and on separate axes. Partitions will also appear as color.
Ignore subset
This box is available only if there is a single subset and the Chart Template relies on the Query Builder. In that case, you might not want to show that subset on the chart. Check this box to ignore the subset. If checked, the options of the Axis/Color Usage will update to reflect the absence of subsets.