The Performance Measure Results Window
Overview and Key Concepts
The Performance Measure Results Window is used to view the results found in the Experimenter's Results Database File. For more information on using the Experimenter, see the Experimenter topic.
The various tabs in this window allow you to explore the data generated by running an Experiment Job. In addition, you can use this window to export data to a report, including an Excel workbook.
Generating Reports
The window has a Generate Report button, near the bottom of the window. Using this button, you can export three kinds of reports:
- Performance Measure Report - An html file showing data related to each Performance Measure.
- Interactive Report Builder - An html file that allows you to assemble both Performance Measure data as well as replication charts. You can export the final result as another html file.
- Excel Workbook - An Excel workbook containing the raw data from the Experiment.
The Performance Measures Tab
The Performance Measures Tab displays the data for a Performance Measure across all replications. It has the following properties:
Performance Measure
Select a Performance Measure to view.
Chart Type
Select a Chart Type. The other properties available on this tab depend on the Chart Type. You can select from the following options:
- Replications Plot
- Frequency Histogram
- Correlation Plot
- Data Summary
- Scenario Comparison
- Raw Data
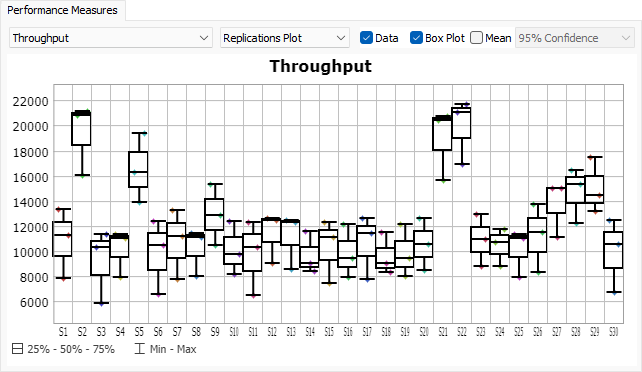
The following properties are available when the Chart Type is set to Replications Plot:
Data
Check this box to display each replication's values for each Scenario on the chart.
Box Plot
Check this box to show the box plot of the Performance Measure's values for each Scenario on the chart.
Mean
Check this box to show the estimated mean of the Performance Measure's values for each Scenario on the chart.
Confidence
If showing the Mean, select a confidence level. The interval will be shown around the mean for each Scenario on the chart.
Chart View
The chart shows the chart for the selected Performance Measure for each Scenario.
The following properties are available when the Chart Type is set to Frequency Histogram:
Number of Bars
Specifies the number of buckets to show on the histogram.
Chart View
The chart shows a histogram of the Replication values for the selected Performance Measure. This chart can be helpful to see the overlapping ranges between scenarios.
The following properties are available when the Chart Type is set to Correlation Plot:
Correlate with
Select a second Performance Measure to correlate with this one.
Chart View
The chart shows the linear correlation between two Performance Measures. The correlation line, as well as the r-squared value, is displayed on the chart.
The following properties are available when the Chart Type is set to Data Summary:
Mean Based on
Select the confidence interval used when estimating the mean.
Chart View
The chart shows a table. Each row of the table deals with a Scenario. The columns of the table show the Mean, the Sample Standard Deviation, the Minimum, and the Maximum.
The following properties are available when the Chart Type is set to Scenario Comparison:
Confidence Level
Select a confidence interval to use when testing for statistical difference between scenarios.
Based on
Select a Scenario to use as a baseline. The other scenarios will be compared to this scenario.
Chart View
The chart shows a table, with one row per Scenario. Given the number of replications, the chart calculates whether two scenarios are statistically different, and the difference between their means.
The following properties are available when the Chart Type is set to Raw Data:
Table
The table shows the raw data for the Performance Measure. Each row represents a Scenario, with one column per Replication.
The Dashboard Statistics Tab
The Dashboard Statistics Tab allows you to view any dashboard chart for any Replication of any Scenario. Dashboard Statistics are only available if the Save charts and output tables for each replication box is checked before running a Job. This tab has the following properties:
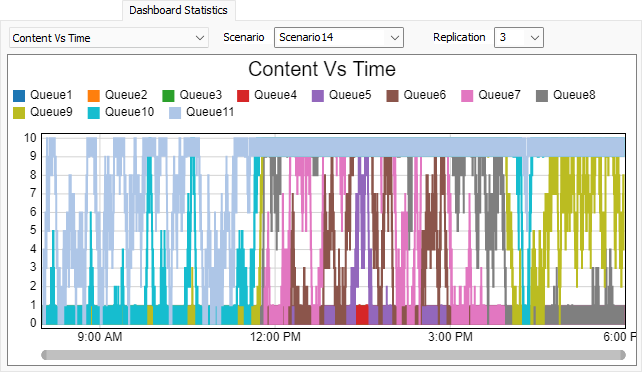
Select Chart
Select which chart you'd like to view
Scenario
Select which Scenario you'd like to view
Replication
Select which Replication you'd like to view
Chart View
The chart shows the selected Chart for the given Scenario and Replication.
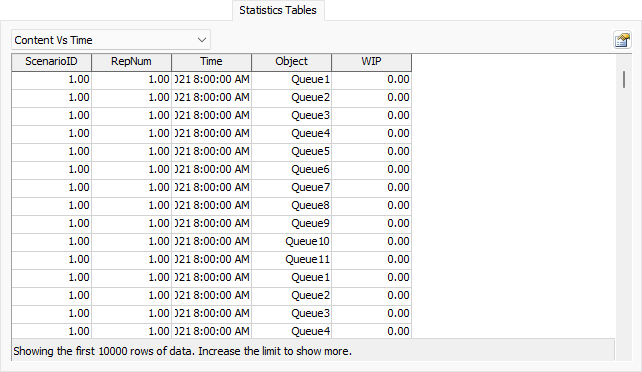
The Statistics Tables Tab
The Statistics Tables tab allows you to view each output table. Output tables include all Statistics Collectors and Calculated Tables in the model, even if those tables are part of a People Table or Chart Template. This tab allows you to see the data for all Scenarios and Replications of an output table as a single table. If you generate an Excel Workbook, that workbook will include one sheet per output table. Output tables are only available if the Save charts and output tables for each replication box is checked before running a Job. This tab has the following properties:
Select Table
Select which output table you'd like to view
Settings
Click the Settings button  to open a popup where you can configure all output tables. That popup has the following
options:
to open a popup where you can configure all output tables. That popup has the following
options:
- View Limit - Limits the number of rows shown in table on this tab. To retrieve all data for the selected table, set this value to 0.
- Scenario ID - Check to show the Scenario ID as a column in the table. The Scenario ID is the database's ID for the Scenario. The first Scenario in the database has an ID of 1. If checked, you can also specify the name of this column.
- Scenario Hash - Check to show the short hash for the Scenario as a column in the table. The Experimenter calculates a unique hash based on the Parameter values, as well as the Stop Time and Warmup Time. This column will contain the last 8 characters from that hash. If checked, you can also specify the name of this column.
- Full Scenario Hash - Check to show the full hash for the Scenario as a column in the table. If checked, you can also specify the name of this column.
- Replication - Check to show the Replication number as a column in the table. If checked, you can also specify the name of this column.
SELECT ... FROM Experiment.OutputTable. These
settings are also used when generating an Excel workbook.
Table
The table shows all rows of the selected output table, for all Scenarios and Replications.
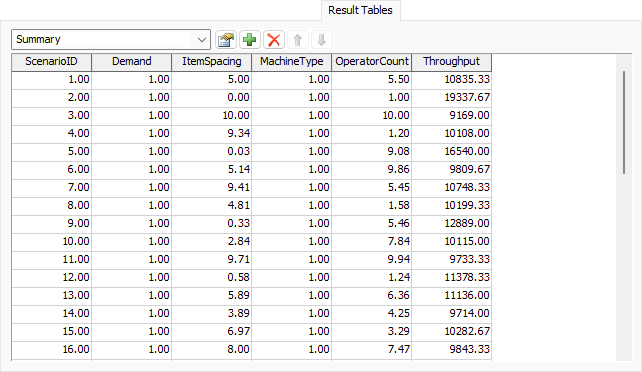
The Result Tables Tab
The Result Tables Tab displays each Result Table defined on this
tab. By default, one Result Table called Summary is defined.
You can query any Result Table using
SELECT ... FROM Experiment.ResultTableName
. If you generate an Excel Workbook, there will be one sheet
per Result Table in the workbook.
You can use this tab to add, remove, and edit Result Tables.
This tab has the following properties:
Select Result Table
Select a Result Table to display or edit. You can also rename the current Result Table using this property.
Settings
Click the Settings button
to open a popup where you can edit the settings for this Result Table.
The popup includes the following options:
- Scenario Name - Check this box to include the Scenario Name as a column in the table. If checked, you can also specify the name of the column.
- Scenario ID - Check this box to include the Scenario ID as a column in the table. If checked, you can also specify the name of the column.
- Scenario Hash Check this box to include the last 8 characters of the Scenario's hash as a column in the table. If checked, you can also specify the name of the column.
- Full Scenario Hash - Check this box to include the full Scenario Hash as a column in the table. If checked, you can also specify the name of the column.
- Run Time - Check this box to include the Run Time of each Scenario as a column in the table. If checked, you can also specify the name of the column.
- Warmup Time - Check this box to include the Warmup Time of each Scenario as a column in the table. If checked, you can also specify the name of the column.
- Parameters - Specifies which Parameters to include as columns in the table.
- Performance Measures - Specifies which Performance Measures to include as columns in the table.
- Row Settings - Specifies the row settings for the table. If set to One row per scenario, you can optionally include the number of replications as a column and specify that column's name. All Parameter and Performance Measure columns will show the average value across all Replications for each Scenario. If set to One row per replication, the table will include a column for the Replication number, and you can specify the name of that column.
Add/Remove/Up/Down
Use these buttons to add, remove, or reorder Result Tables.
Table View
Displays the data in the Result Table.
The Console Output Tab
The Console Ouput Tab allows you to view any messages printed to the System or Output Consoles for every Scenario and Replication. It has the following properties:
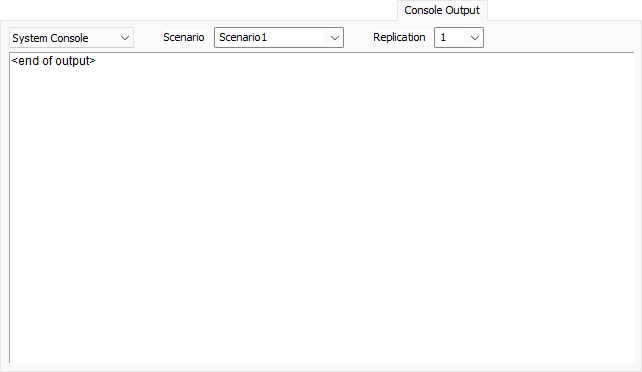
Select Console
Select which console's messages to view.
Scenario
Select which Scenario to view.
Replication
Select which Replication to view.
Console View
This area shows the selected output.
The message <end of output>
appears after any messages, and is not part
of the original data.
The State Files Tab
The State Files Tab shows any available State Files that have been saved, arranged by Scenario and Replication. State Files are only available if the Save state for each replication box is checked before a Job runs. This tab has the following properties:
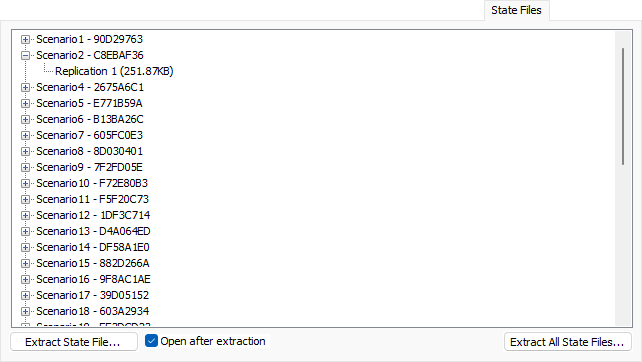
Select File
Use this tree to select a State File from a particular Scenario and Replication.
Extract State File...
Click this button to extract the selected State File from the Database Results File and save it with a new name.
Open after extraction
If checked, when you extract a single state file, a new FlexSim instance will open the saved state file.
Extract All State Files...
Click this button to select a directory. All State Files in the Result File Database will be extracted and saved to that directory.