Composite State Pie Template
Overview and Key Concepts
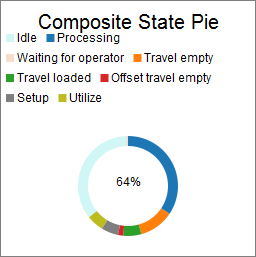
This composite template creates a pie chart, and calculates utilization based on each object's time in various states. Each segment shows the average time of all included objects in a state. The utilization value shown is the average utilization.
Properties Panels
The Composite State Pie template uses the following properties panels: