Task 1.3 - Build a Process Flow Model
Task Overview
In this tutorial task, you'll build an identical simulation model to the 3D model you just built, but this time you'll use the Process Flow tool to do it. The Process Flow tool is more abstract and theoretical than FlexSim's 3D modeling tools, which might have some appeal to some users. The other advantage of using the Process Flow tool is that you can create custom model logic much more easily in this tool. By experimenting with both methods of simulation modeling, you'll learn which method is more appropriate for your specific simulation projects.
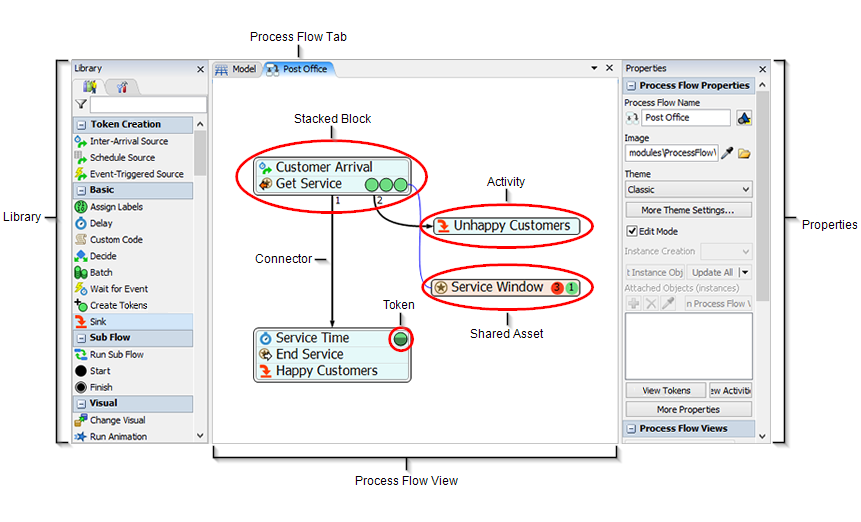
In this tutorial task, you'll learn some of the basics about navigating inside of FlexSim's Process Flow tool as you build a process flow model. The most important elements of the Process Flow tool are labeled in the following image:
Step 1 Adding and Connecting Process Flow Activities
In this first step, you'll create a process flow. The first thing you'll need to do is choose the type of process flow you'll make. For this tutorial, you'll make a General Process Flow because this type of process flow is ideal for creating theoretical simulation models that can run independently of 3D models.
Then, you'll begin adding and connecting some activities to your process flow. An activity is like a chunk of logic or a logical operation in a simulation model. There are a number of different ways you can add and connect activities. In this step, you'll try out all of these methods.
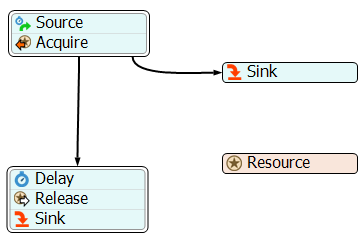
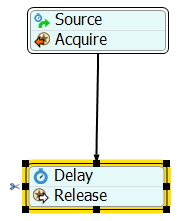
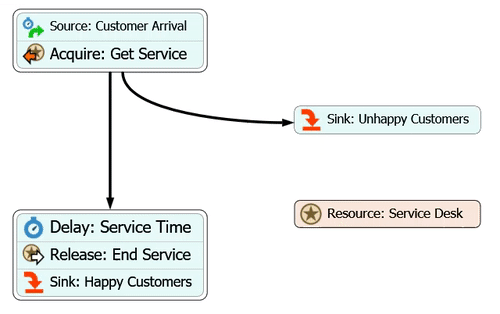
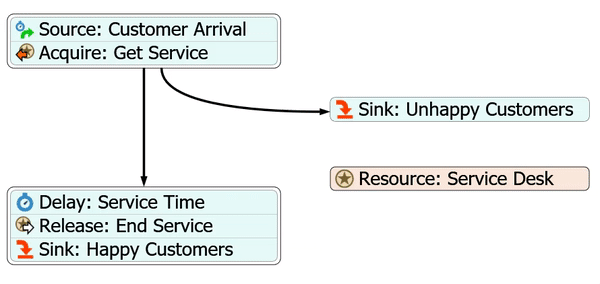
For now, you'll add the activities to your process flow without an explanation of what each activity will do. You'll learn more about what each activity does in step 3 of the tutorial. When you're finished with this step, your process flow should look approximately like the following image:
To add these activities:
- Make sure you are using the same simulation model that you created in the previous tutorial task.
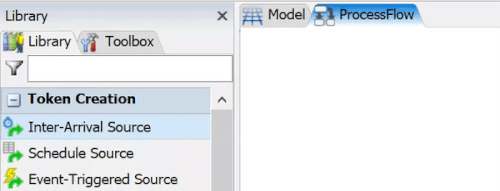
- Click the Process Flow button on the main toolbar to open a menu. Select Add a General Process Flow to create a general process flow and open it as a separate tab in the center pane. Also, notice that when the Process Flow view is open and active, the Library changes to display the process flow activities.
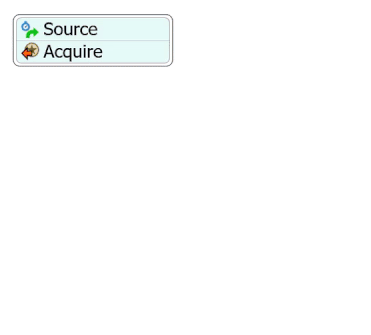
- From the Library, under the Token Creation group, drag an Inter-Arrival Source activity into the process flow.
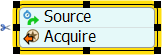
- From the Library under the Shared Assets group, drag an Acquire Resource activity and drop it on top of the Source activity. Notice that the two activities have been snapped together, as shown in the following image. They are now automatically connected in a block (also sometimes referred to as a stacked block).
- Now you'll try the second method for adding and connecting an activity using a
connection coming out from the stacked block. Point your mouse on the bottom edge of the
block. The mouse icon will change to a chain link.
 Click the edge of the block and, while
holding down the mouse, drag it a little bit toward the bottom of the screen. Notice
that there is a connector coming from the edge of the block to your mouse pointer. When
you release the mouse, the Quick Library will appear. Under the
Basic group, click the Delay
activity.
Click the edge of the block and, while
holding down the mouse, drag it a little bit toward the bottom of the screen. Notice
that there is a connector coming from the edge of the block to your mouse pointer. When
you release the mouse, the Quick Library will appear. Under the
Basic group, click the Delay
activity.  The following
animated gif shows this step:
The following
animated gif shows this step: - Now you'll try the last method for adding and connecting a new activity by adding an
activity directly to the end of a stacked block. Point your mouse on the bottom edge of
the Delay activity. The mouse icon will change to a chain
link. Double-click this edge to open the
Quick Library again.
- Under the Shared Assets group, click the
Release Resource activity.

- At this point, you've tried using all the different methods for adding activities. Using your preferred method, add and connect a Sink activity after the Release Resource activity.
- Some activities can have more than one outgoing connector, such as the Acquire Resource activity. Create a second connector coming out from the Acquire activity and connect it to a Sink activity, as shown in the following image.
- From the Library, under Shared Assets, drag a Resource activity into the process flow. It shouldn't be connected to any other activities.
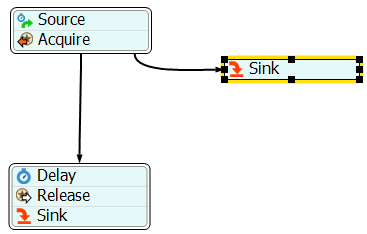
Check to make sure that your process flow layout looks similar to the image at the beginning of this step.
Step 2 Rename and Resize Activities
In this step, you'll rename all of the activities to be more descriptive. This step will demonstrate two different methods for renaming activities.
Be aware that changing an activity's name will have no effect on the way that activity behaves, but renaming activities will make your process flow a little more intuitive and understandable. This step will also explain how to resize activities, since some of the activities will be too small to display the new names using a readable font size.
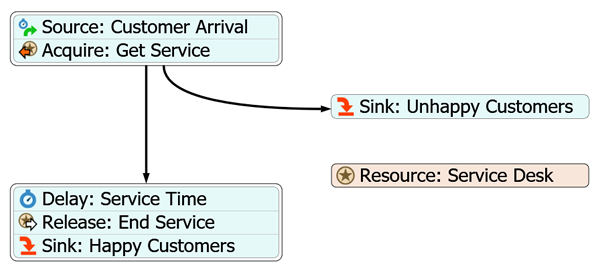
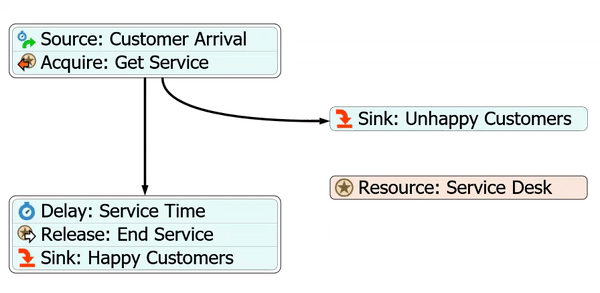
When you finish this step, your process flow should look approximately like the following image:
To rename the process flow activities:
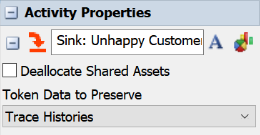
- Click the first Sink activity (the one connected to the Acquire activity) to select it.
- In Properties under Activity Properties, click inside the Name box. Change the current text to Sink: Unhappy Customers to change the Sink activity's name, as shown in the following image:
- Now you'll try the second method of changing an activity name. Double-click the second Sink activity (the one connected to the Release activity) to highlight its name. Type Sink: Happy Customers as the new name and hit the Enter key.
- At this point, you've tried using the two different methods for renaming activities. Using your preferred method, rename the following activities as listed in the following table:
- Notice that the names of some of the activities now use a small font because they're very long. Now you'll resize the activity block to make the full name visible. Click the first activity block to select it.
- When the activity block is selected, the entire border of the activity block turns yellow and the black sizer boxes appear. Click the middle sizer box on the right edge and drag it a little to the right until the full name matches the same font size as the other activities.
- Repeat the previous step for the second activity block until the font is at a comfortable size for you.
| Activity | New Name |
|---|---|
| Source | Source: Customer Arrival |
| Acquire | Acquire: Get Service |
| Delay | Delay: Service Time |
| Release | Release: End Service |
| Resource | Resource: Service Desk |
Check to make sure that your process flow layout looks similar to the image at the beginning of this step.
Step 3 Edit Activity Properties
In this step, you will edit the properties for the activities you added in the previous steps. The following is an overview of how the activities in this process flow will function:
| Activity | Explanation |
|---|---|
| Resource: Service Desk | You might have noticed that the Resource activity is a different color than the
other activities. That's because it is a shared asset. Shared assets don't
interact with tokens the way other activities do. They can be used to build complex
logic into process flows by controlling access to finite resources. The customer service center will begin with only one employee, which is represented by the Resource shared asset in this model. In one sense, the customer service representative is a finite resource. When that representative is busy helping a customer, he or she can't help other customers until the current customer's request has been completed. |
| Source: Customer Arrival | Most process flows begin with a source activity that will create the tokens that
will move through the other activities. In this model, the tokens will represent
customers coming to the customer service center. This process flow uses an
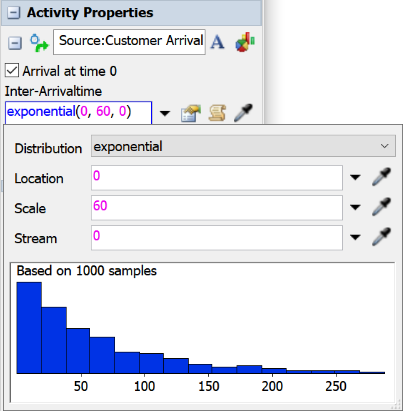
Inter-Arrival Source to represent the customers, who will arrive at random
intervals. In this step, you'll change the arrival rate for customers. Just as you did in the 3D model, you'll set the arrival rate so that a customer arrives approximately every minute. You'll use the exponential distribution to randomly calculate the arrival rate with an average of 60 seconds. |
| Acquire: Get Service | This activity will represent a customer standing in line waiting to receive
service from a customer service representative at the service desk. If the
representative is busy, the customer will wait in line until the representative is
free. In order to simulate certain customers getting frustrated and leaving when the line is too long, you'll change the maximum wait time on this activity. If a customer waits more than 200 seconds, they will become frustrated. Tokens representing frustrated customers will be sent to the Unhappy Customers sink. |
| Sink: Unhappy Customers | This activity will remove the token (the customer) from the model and track the number of customers that exited the process flow through this particular sink. In other words, it will track the number of customers that got frustrated and left. |
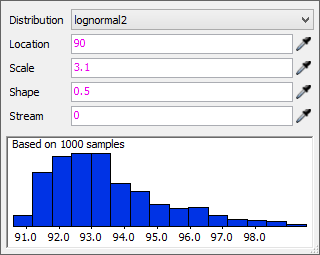
| Delay: Service Time | This activity will represent the time it takes a representative to help a customer. You'll change the delay time to use a random statistical distribution that will take approximately 92 seconds to help a customer. |
| Release: End Service | This activity will release the customer service representative to help another customer. |
| Sink: Happy Customers | This activity will remove the token (the customer) from the model and track the number of customers that exited the process flow through this particular sink. |
There are two different ways you can edit an activity's properties. In this step, you'll try out both of these methods:
- Click the icon on the Resource activity to open its properties directly in the process flow:
- You'll use the default properties for now. Confirm that the
Count property is set to
1.00, meaning that there is only one resource available for now. - Now you'll edit some activity properties using the Properties pane. Click the Source: Customer Arrival activity to select it. Notice that Properties (in the far right pane) displays all the properties for all the activities in this stacked block.
- In Properties, under the Source: Customer Arrival group, check the Arrival at time 0 box so that a token gets created right when the model begins running.
- Notice that the Inter-Arrivaltime is already set to use
the exponential statistical distribution, with customers arriving randomly on average
every 3 seconds. Click the Edit Properties button
 to open the distribution chooser and
edit the properties for this distribution. In the Scale
box, change the number to
to open the distribution chooser and
edit the properties for this distribution. In the Scale
box, change the number to 60. - Next, you'll connect the Acquire Resource: Get Service
activity to the Resource: Service Desk shared asset. Notice
there is a red Exclamation icon
 to the right of the
Acquire Resource: Get Service activity. This means that
this activity is not connected to a resource, which is required. Click the
Exclamation icon. The mouse will turn into a sampler
to the right of the
Acquire Resource: Get Service activity. This means that
this activity is not connected to a resource, which is required. Click the
Exclamation icon. The mouse will turn into a sampler
 to indicate you are in sampling
mode.
to indicate you are in sampling
mode. - Click the Resource: Service Desk shared asset to link them. A blue line will appear to show they are linked.
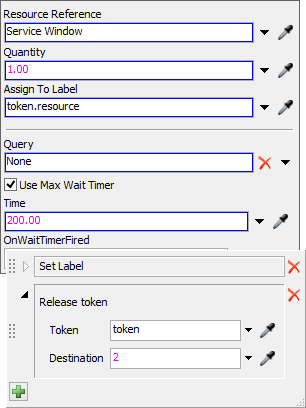
- In the properties for the Acquire Resource activity, check the Use Max Wait Timer checkbox to turn on the maximum wait time. A few additional settings will appear underneath the checkbox.
- In the Time box, change the time to
200. - Next to the OnWaitTimerFired trigger, click the
Edit Properties
button. Click the arrow next to the
Release Token picklist to open its picklist options. In the
Destination box, type
2. This setting will send customers (tokens) that reach the maximum wait time to the second connector, which is connected to the Unhappy Customers activity. - In the properties for the Delay: Service Time activity.
Click the Edit Properties
button next to the
Delay Time box to open the Distribution Chooser.
- From the Distribution menu, select the
lognormal2 distribution. Set the following parameters:
- Location -
90 - Scale -
3.1 - Shape -
0.5
- Location -
Now that you're done editing the process flow properties, consider saving your model.
Step 4 Run the Simulation
Running a process flow simulation is just the same as running a simulation for a standard 3D model. Once the simulation starts, tokens will move through the process flow activities. As a token enters each activity, it will apply that activity's logic. To run the simulation model:
- On the simulation control bar, click the arrow next to the Run Speed to open the options. In the Custom box, change the time to 4.00.
- On the simulation control bar, press the Reset button to clear any data from the process flow.
- Then press the Run button to watch the simulation at work.
As you watch the simulation, you should see the following:
- There should only be one token at a time in the Delay: Service Time activity (representing a customer being helped)
- There should be multiple tokens waiting in Acquire: Get Service activity (representing customers waiting in line)
- You'll only ever see tokens inside the Acquire: Get Service activity and the Delay: Service Time activity. All of the other activities perform their logic in 0 time with no created events so they won't show tokens moving through them. If you want to see a token move through each activity you can use the Step button on the simulation control bar to step a token through each of its activities.
- You'll notice there is a green and red circle that will appear on the Resource: Service Desk resource as you run. The green icon shows how many tokens have acquired a resource. In this case there is only 1 resource available so this number will never be any higher than 1. The red icon is the number of tokens that are attempting to acquire a resource but cannot because none are available.
Step 5 Create Process Flow Charts
Now that all the logic of your process flow is set up, you'll create a dashboard to record the number of happy customers and unhappy customers created by this process flow. You'll pin the input vs. time statistic for the Sink: Unhappy Customers to the dashboard you created in the previous tutorial task.
The process for pinning statistics from a process flow is nearly identical to the one for 3D objects. When you pin a statistic to the dashboard, it will automatically create a statistics collector. In this step, you'll edit the statistics collector so that it listens to both the Unhappy Customers and Happy Customers sinks.
You'll also pin the staytime for the Acquire: Get Service activity, which is analogous to the customer waiting line in the 3D model. To pin these statistics:
- Click the Sink: Unhappy Customers activity to select it.
- In Properties, click the Statistics button
 button to open the statistics window
for this activity.
button to open the statistics window
for this activity. - You'll want to track how many tokens enter this activity. So, next to the
Input box, click the Pin
button
 to open a menu. Point to
Pin to Customer Service Metrics, then select
Input vs Time. The chart will appear on the dashboard.
to open a menu. Point to
Pin to Customer Service Metrics, then select
Input vs Time. The chart will appear on the dashboard. - Double-click the chart to open its Chart Properties window.
- In the Name box at the top, delete the current chart name and type Customers (Process Flow) in its place.
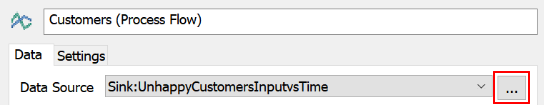
- In the Data tab, confirm that the Data Source menu displays Sink:UnhappyCustomersInputvsTime. Then press the ... button next to this menu to open the properties window for this statistics collector.
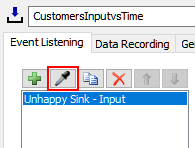
- In the name box at the top of the properties, shorten the statistics collector's name to CustomersInputVsTime.
- In the Event Listening tab, select the Sink - Input event in the event list to select it. In the Event Details, change the Name of the event to Unhappy Sink - Input.
- Click the Sampler button
above the event list to enter sampling
mode.
- If the process flow isn't visible, point the sampler over the ProcessFlow tab.
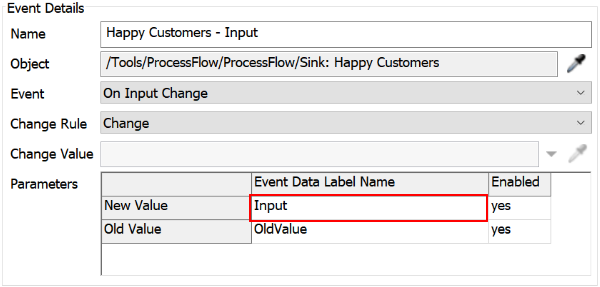
- In the process flow, click the Sink: Happy Customers to open a menu. Select On Input Change.
- With this newly created event selected in the event list, change the Name of the event to Happy Sink - Input.
- In the Parameters table, in the New Value row under the Event Data Label Name column, delete the current text and type Input.
- In the event list, click the Unhappy Sink - Input event to select it. In the Event Details in the Parameters table, in the New Value row under the Event Data Label Name column, delete the current text and type Input.
- Press the OK button to save the changes and close the window. Close all the other open windows to save their changes too.
- In the process flow, click the Acquire: Get Service activity.
- In Properties, click the Statistics button
button next to the
Acquire Get Service activity to open the statistics window
for this activity.
- Next to the Staytime box, click the
Pin button to
open a menu. Point to Pin to Customer Service Metrics, then
select Staytime Vs Time. The chart will appear on the
dashboard.
- You're actually only interested in the statistics collector that was automatically generated for this statistic, so click the new chart and delete it. You can close the statistics window as well.
- With the dashboard open and active, notice that the Library changes to show different chart options. Drag a Histogram chart into the dashboard. It will automatically open the Chart Properties.
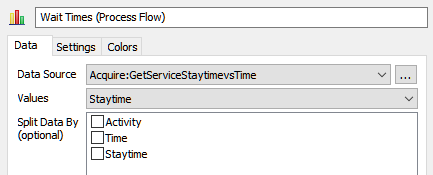
- In the Name box at the top, delete the current chart name and type Wait Times (Process Flow) instead.
- In the Data tab, click the Data Source menu and select Acquire:GetServiceStaytimevsTime.
- Click the Values menu and select Staytime.
- Click the OK button to save the changes and close the window.
Consider saving your simulation model.
Step 6 Analyze the Data
In this step, you'll run the data and compare the results from the process flow model to the 3D model.
Reset and run the model. When you're finished, your results should look similar to the following image:
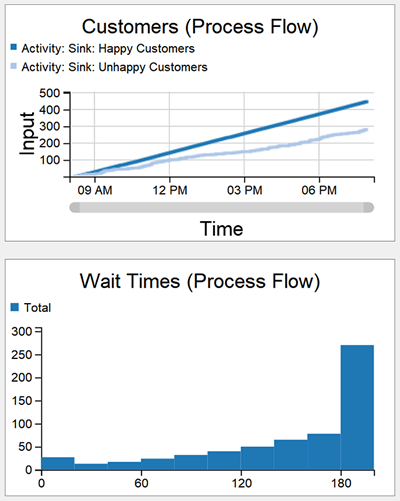
Similar to the results from the 3D model, you'll notice that there are only slightly more happy customers than unhappy customers, which isn't a good sign. Also notice that the average wait times are very close to the maximum wait time of 200 seconds. Clearly, this is a business process that could be improved.
Conclusion
After completing this tutorial, you've hopefully learned the basics of building a model in the Process Flow tool. In the next tutorial task, you'll learn how to improve the visuals of your 3D model and you'll learn how to use a process flow to create custom logic for a 3D model. You'll also experiment with adding an additional service desk to see if that will solve the business system's problem. Continue to Tutorial Task 1.4 - Link the Models.