Sankey Diagram
Overview and Key Concepts
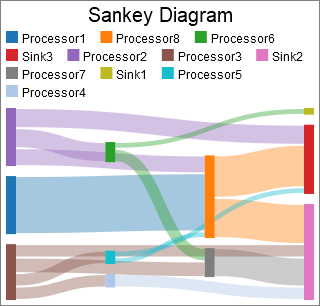
The Sankey Diagram allows you to visualize flow between various points in a system.
Data Format
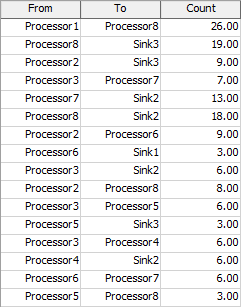
This chart assumes that each row of the Data Source contains information about individual links. One column will have a Source value, another will have a Target value, and a third will have a Weight value. The Target and Source values are used to determine the location of the link. The Weight value will determine the thickness. Here is the table for the chart shown above:
Performance Measures
The Sankey Diagram provides two performance measures per node in the chart: the total value going in to the node, and the total value exiting the node.
Properties Panels
The Sankey Diagram uses the following properties panels: