Empirical Distribution
Overview and Key Concepts
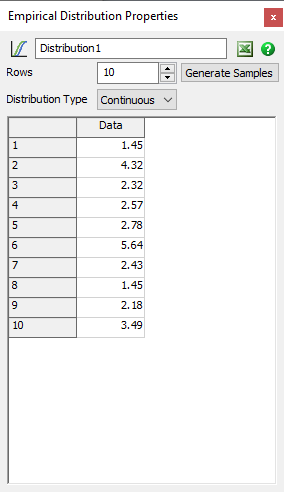
The Empirical Distribution tool is used to generate random variates given a table of empirical data.
The Empirical Distribution tool is accessed from the Toolbox.
Selecting Distribution Type
The two distribution types are continuous and discrete.
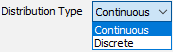
- Continuous - If continuous, numeric values are generated between values defined in the table.
- Discrete - If discrete, values are generated matching values defined in the table.
Data Input
Data can be inputed into the table either manually or through the use of the excel importer. Data does not have to be in any order.
If discrete is selected as the distribution type, then weights can be inputed. By selecting Weighted, a second column appears in the table for weight input. Weights can be any numeric value and will be weighted against eachother and not a specific value.
Visualization
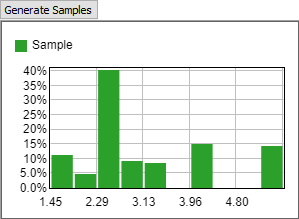
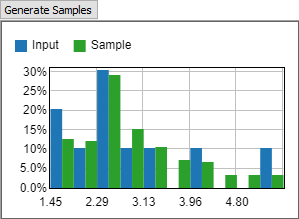
A Graph of values generated by the Empirical tool.
 - Clicking this will display the inputed data and samples generated from the inputed data.
If the distribution is continuous, a histogram of both the inputed data and samples will be created.
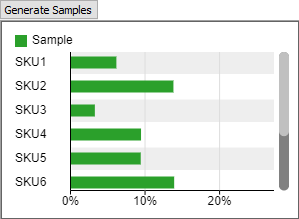
If the distribution is discrete, the graph will change based on the data type selected and if Weighted is selected. If the data type is string, a barchart will be used instead of a histogram.
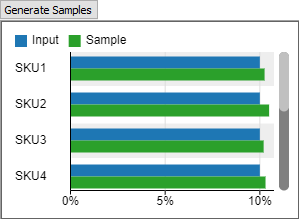
If Weighted is selected then only the samples will be shown.