Performance Profiler
Overview and Key Concepts
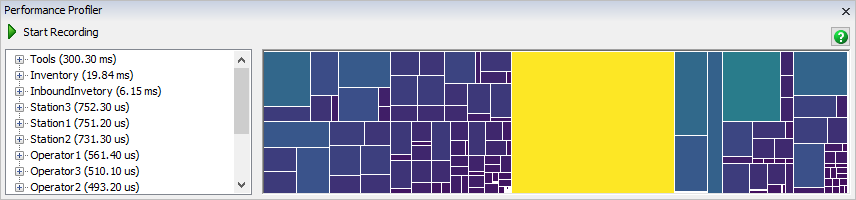
The Performance Profiler window allows you to record how much time the CPU spends in profiled functions while the model runs:
The Performance Profiler works by recording the time spent in certain FlexSim functions as the model runs. Once recording is finished, the Performance Profiler will present the data so that you can which of the profiled functions required the most time.
The Performance Profiler has two main views for displaying performance data. The first view is the Performance Tree, the view on the left. This view shows each node in the tree, and how much time the CPU spent executing code associated with that node. The list of nodes is sorted by how much time was spent in each node.
The second view in the Performance Profiler is the Performance Graph. This view draws each node as a box. Bigger boxes indicate that more CPU time was spent at a particular node, and smaller boxes indicate that less CPU time was spent at that node. The boxes are also colored by CPU time: the brightest, most yellow box corresponds to the node where the CPU spend the most time. The darkest, most purple box corresponds to the node where the CPU spent the least time.
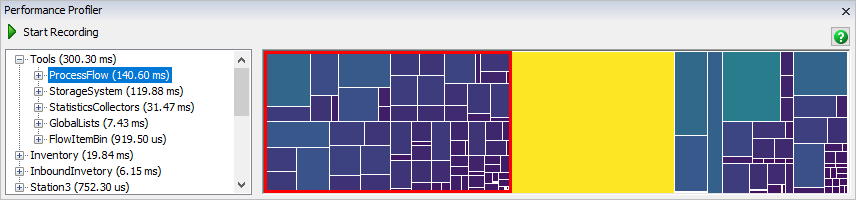
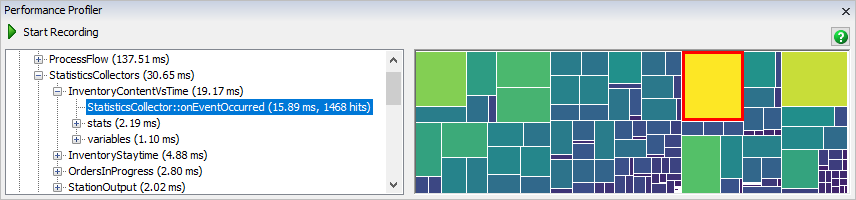
These two views work together. For example, you can click on a node in the Performance Tree View, and the Performance Graph will show that node bounded in red:
Alternatively, you can click on a box in the Performance Graph. This will highlight that box in the Performance Tree:
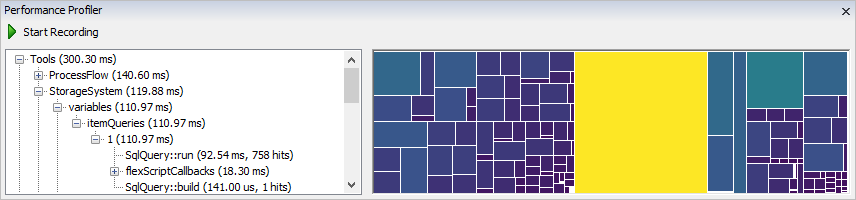
In this example, the model is using the Storage System to find items for pickers to pick. The Storage System is running a query to find items, and the Performance Profiler shows us that the query ran 758 times, and took 92.54 ms to run in total.
In some cases, you can use the Performance Profiler to improve the run speed of your model. In the previous example, we saw that the model spent most of its time running a query to find items. However, that query used an ORDER BY clause. Without that ORDER BY clause, the performance profiler tells a very different story:
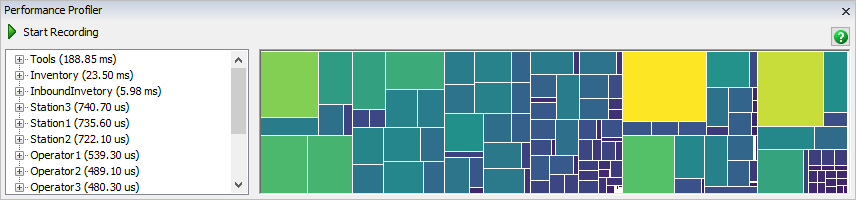
Without the ORDER BY clause, the model doesn't spend nearly as much time in the Tools folder as it did before. In this particular model, the next busiest node is in a Statistics Collector:
In this way, the Performance Profiler allows you to see the CPU cost of each object or feature in a model. Using this information, you may be able to find ways to reduce the total CPU cost of your model.
You can access the Performance Profiler from the Debug menu on the main toolbar.
Properties
The Performance Profiler has the following properties:
Start/Stop Recording
This button will either start or stop recording a performance profile. You can only record a single profile at a time. When you begin recording a profile, any previous profile data will be erased. Non-busy time is not included while recording a profile.
Performance Tree
If you have recorded a performance profile, this view will show the time used by each node in the tree, sorted by total time used. You can click on nodes in this view to highlight them in the Performance Graph. You can also right-click on a node and choose View Down or View Up. If you choose View Down, then the Performance Tree and Performance View will update to show only the specified nodes and its subnodes.
Performance Graph
If you have recorded a performance profile, this view will draw a visual representation of the time used by each node in the tree. Bigger and brighter boxes represent nodes that used more time.