The Text Panel
The Text panel contains options for displaying text on charts.
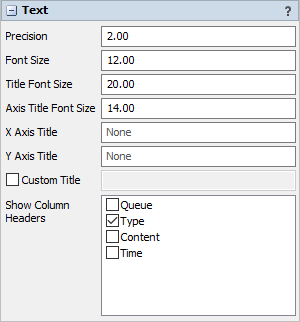
The following properties are on the Text panel:
Precision
Specify the number of decimals to use on the chart. Note that this will only apply to text for floating point values.
Font Size
Set the font size for general text on this chart in pixels.
Title Font Size
Set the font size for the chart title in pixels.
Axis Title Font Size
Set the font size for the axis titles in pixels.
X Axis Title
Optional. Specify the text for the x-axis title.
Y Axis Title
Optional. Specify the text for the y-axis title.
Custom Title
If checked, the chart will show this property's value as the chart title. You can use this property to specify a title with special characters, or to specify that no title should be shown.
Show Column Headers
This list allows you to specify which values, if that value is written as text on the chart, should include the column header for that value. For example, if you have a Type column, you might want the chart to show "Type: " before any type values are written.