Memory Profiler
Overview and Key Concepts
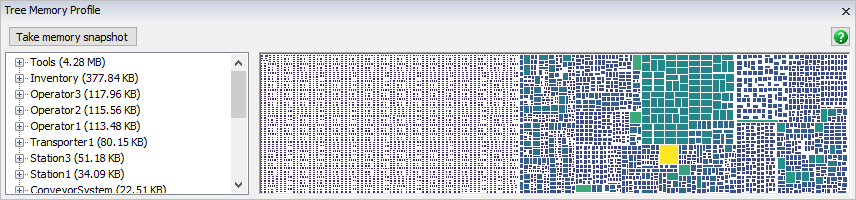
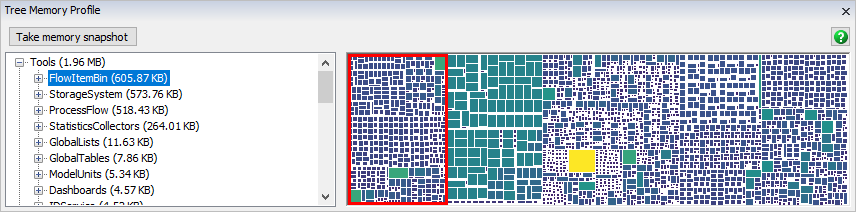
The Memory Profiler window allows you to see how memory is being used by FlexSim:
The Memory Profiler works by traversing FlexSim's tree and estimating the memory use of each node.
The Performance Profiler has two main views for displaying memory data. The first view is the Memory Tree, the view on the left. This view shows each node in the tree, and the estimate for that node's memory use. The list of nodes is sorted by how much memory it uses.
The second view in the Memory Profiler is the Memory Graph. This view draws each node as a box. Bigger boxes indicate that more memory is used by a particular node, and smaller boxes indicate that less memory is used. The boxes are also colored by memory use: the brightest, most yellow box corresponds to the node that uses the most memory. The darkest, most purple box corresponds to the node that uses the least memory.
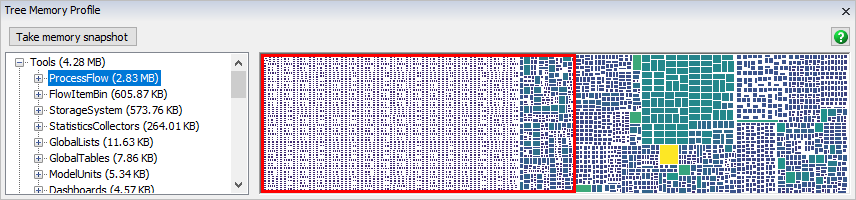
These two views work together. For example, you can click on a node in the Memory Tree View, and the Memory Graph will show that node bounded in red:
Alternatively, you can click on a box in the Memory Graph. This will highlight that box in the Memory Tree:
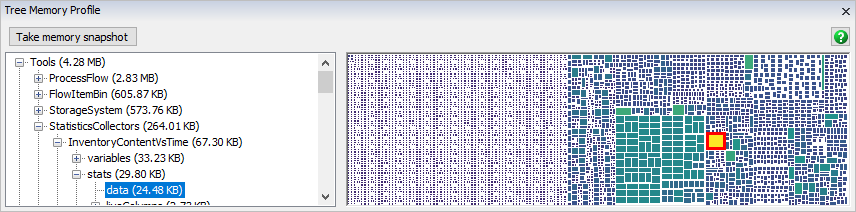
In this example, the model is using a Statistics Collector to record some data. That particular Statistics Collector is the node that is using the most data.
In some cases, you can use the Memory Profiler to reduce the memory use of your model. In this example, a large amount of memory is allocated just to tokens in the main Process Flow:
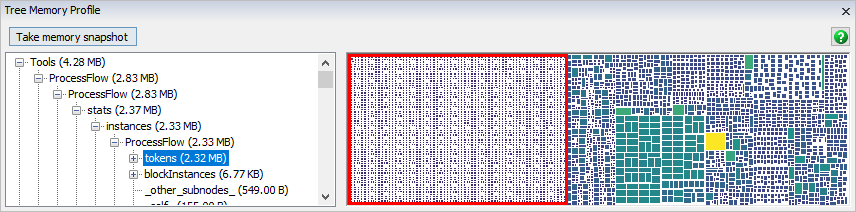
This model happens to have a source that generates tokens, but isn't connected to any activities; perhaps the modeler forgot to remove it. Without that source generating useless tokens, the Memory Profiler shows a different story:
Now the Tools folder uses 2 MB less memory. This example demonstrates how the Memory Profiler can help you find and remove unnecessary memory use from your model.
You can access the Memory Profiler from the Debug menu on the main toolbar.
Properties
The Memory Profiler has the following properties:
Take memory snapshot
Click this button to create a new estimate of the memory being used in the tree. You can only view one snapshot at a time, so taking a new snapshot will delete the old one.
Memory Tree
If you have taken a memory snapshot, this view will show an estimate of the memory used by each node in the tree. This list is sorted by estimate. You can also right-click on a node in this tree and choose View Up or View Down. If you choose View Down, both the Memory Tree and the Memory Graph will update to show the chosen node as if it is the top node. View Up allows you to back out of the view.
Memory Graph
If you have taken a memory snapshot, this view will draw a visual representation of the memory used by each node in the tree. Bigger and brighter boxes represent nodes that used more memory.