Overview of Advanced Data Gathering
Reasons to Use Advanced Data Gathering Methods
The majority of simulation projects will only need the standard data gathering methods. (See Key Concepts About Data Gathering for an overview of the standard methods.) However, your simulation project might require more advanced data gathering methods. Typical situations in which it might be useful to use advanced methods include:
- Your project needs custom statistics - FlexSim provides a wide variety of standard statistics that will fit many project's needs, but it can't necessarily anticipate every possible data-gathering need that a simulation project might have. Fortunately, you can use the Statistics Collector and Calculated Table tools to gather most kinds of custom data that might be unique to your simulation project.
- You would like to experiment with different model setups - You might want to run a simulation model multiple times, changing one or more variables to see how these changes affect key performance measures. The Experimenter and Optimizer tools can run these experiments and capture this kind of data. See Key Concepts About Experiments for more information about these two tools.
Advanced Data Gathering Methods
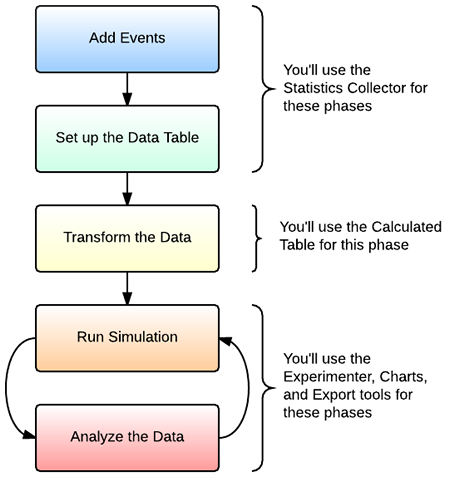
The following image provides an overview of the major phases of the data gathering process for custom statistics:

The following sections will explain each phase of the process and link to other relevant topics for more detail.
Add Events
In this phase, you'll create a statistics collector and determine which objects and events you want to gather data from. Later, the statistics collector will listen to these events during a simulation run and record data about these events.
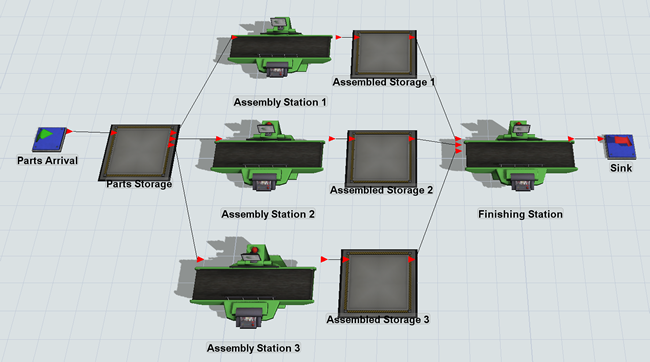
For example, imagine you want to study the stay time of an item, meaning the amount of time it takes an item to flow through an assembly line. First, you'd build a simulation model of the assembly line in FlexSim:

You'd then create a statistics collector that will listen to the events in the model that are relevant to the item's stay time. In the model shown in the preceding image, you could set up a statistics collector to listen to the OnEntry event on the Parts Storage queue, which fires whenever an item enters the queue. You could also set it up to listen to the OnExit event on the Finishing Station processor, which fires whenever an item moves from the processor to the sink. Listening to these two events allows you to record the time that each event happens for each flow item as it moves through the simulation.
See Using the Statistics Collector for more in-depth information about this process.
Set Up the Data Table
While the model runs, the statistics collector will capture all the data from the objects and events you are listening to and put all of this raw data into a table called the data table. For that reason, you need to format the data table to determine how it will add rows to the table during the simulation run and how it will populate the content of the cells under each column.
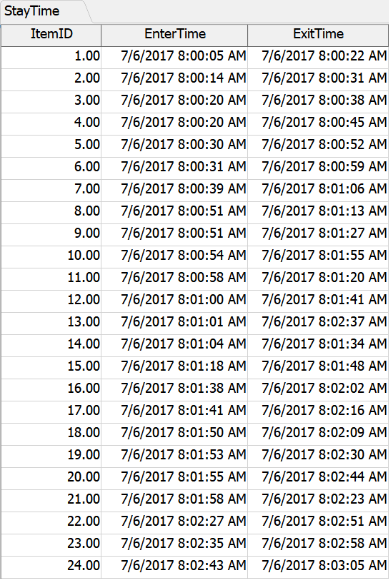
To return to the example used in the previous section, you would set the collector's data table to create a row for each unique flow item that enters the Part Storage queue. The data table will record the time that the item enters the queue under one column. Then, when the item exits the Finishing Station processor, the Data Table can record the time the time the item exited in another column.
When you run the model, the raw data that is generated in your data table will look similar to the following image:

See Using the Statistics Collector for more in-depth information about this process.
Transform the Data
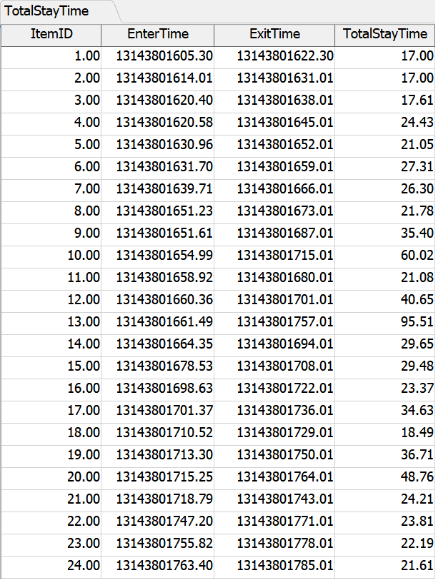
You might want to take the raw data that was generated in a statistics collector's data table and transform, filter, or combine the data in some way to create new data. You'll transform this data by creating a calculated table. See Using the Calculated Table for more information.
To return to the example used in the previous sections, once you've gathered the raw data about when items enter the first queue and exit the final processor, you could use a calculated table to subtract the two values and get the total stay time for each item.

Run the Simulation Model
While the simulation runs, the statistics collector will gather the raw data and the calculated table will transform this data as specified. See Running a Simulation for more information.
Analyze the Data
To analyze the data, you could:
- Display the data in a chart on a dashboard (see Key Concepts About Dashboards and Charts for more information)
- Run experiments or optimizations to determine the ideal model setup (see Key Concepts About Experiments for more information)
- Export the data from any of these tools so that you can analyze it using third party software
Types of Events
Before reading this section, make sure you are familiar with the concepts explained in the Key Concepts About Events topic.
Statistics collectors can listen to a wide variety of events in the simulation model. The following section explains the general categories of events that they can listen to.
3D Object Events and Process Flow Events
Standard events are the events that occur while a 3D object is interacting with flow items during a simulation run. Events can also refer to the events that occur when a process flow activity interacts with a token. Standard events are usually associated with a trigger that will fire when immediately after the event occurs. For example, when a processor is finished processing a flow item, the OnProcessFinish trigger will fire. When a token enters a process flow activity, the activity's OnEntry trigger will fire.
Statistics collectors can collect information from a 3D object or process flow activity any time a specific event occurs. When that event occurs, it will gather any relevant data that is associated with that particular event. For example, it can gather data about:
- The ID of the item or token that caused the event to occur
- The time the event occurred
- The state the object was in when the event occurred
- The value of labels associated with the item at the moment the event occurred, etc.
Be aware that you have to specifically tell a statistics collector which information you would like it to collect at the time the event occurs.
Group Events
You can listen to groups of 3D objects or process flow activities, not just individual objects or activities. When an event happens to any member of a group, a statistics collector could record it. For example, you could put several processors in a group called Work Stations and then listen for any time the OnProcessFinish trigger fires on any processor in the group.
Listening to a group of objects or activities can be a good method for making your model scale well as it grows in complexity. You will only have to set up a statistics collector once to listen for events on all the objects in a group rather having to add each individual object as they get added to the simulation model. See Groups for more information.
Change Events and Tracked Variables
In general, change events are events that listen for any statistical change to occur on a 3D object or activity. When that statistical change occurs, a statistics collector can record relevant data. For example, a statistics collector could monitor the content of a queue in the 3D model. If the content goes above or below a certain threshold, the collector could record the time that occurred. It could also record when it drops back down below the threshold.
You can also listen to state changes. For example, you could track any time an operator changes from an idle state to a utilized state. Statistics collectors allow you to define the event's change rule, which is the criteria that will cause a statistical event to recorded in the data table.
Statistics collectors can also listen to any tracked variables that you have created to track custom statistical changes. See Tracked Variables for more information about this tool.
Timer Events
You can set up statistics collector to collect data at regular timed intervals called timer events. When one of the timer events occurs, the statistics collector can record data about the simulation model as it exists in that moment of time. As with standard, object-based events, you also have to tell the statistics collector specifically which information you'd like to collect.
Using FlexScript in the Statistics Collector
When you add events to a statistics collector, it will listen for that event in the simulation model during a simulation run. Every time that event occurs, the statistics collector will create an event data object. This object will only exist for a short period of time during a simulation run. When the event occurs, it will gather any information you wanted (such as data from labels or from the event parameters). The event data object will then populate the data table with the information it collected. The event data object will be destroyed after it has finished updating all the rows and columns you specified in the data table.
If you need to refer to this object using FlexScript, you should use the variable
data. For example, when you set up the statistics collector, imagine that you
assigned the flow item the name MyItem when you were matching labels to the event
parameters. Imagine that this flow item in the 3D model has a label called
ProductType on it. To get the value of the ProductType label on the flow item, you
would use this syntax: data.MyItem.ProductType
If the statistics collector can't find a label, it will display an error message. To
prevent this problem, you could end your syntax with a ?. This question mark
tells the system to return an empty value for the label if it doesn't exist. The syntax
would look like this: data.MyItem.ProductType?
To use FlexScript to get information from the event node that is associated with a
specific event, you would use this syntax: data.eventNode