Financial Chart
Overview and Key Concepts
The financial analysis chart allows you to give objects and flowitems cost data based upon various parameters and states.
The Objects Tab
There are five ways to add objects to this chart:
- Browse by Class - This method of adding objects sorts the objects by class. To select an entire class, click on the type icon. Click on an object to select or deselect it.
- Browse by Group - This method of adding objects sorts the objects by group. To select an entire group, click on the type icon. Click on an object to select or deselect it.
- Browse by Object - This method of adding objects lists all objects in the model. Click on an object to select or deselect it.
- Select by Dragging - This method of adding objects uses the 3D model view. Simply drag the target icon from the current window to an object in the model you would like to add.
The objects tab has the following properties:
| Icon | Description |
|---|---|
 |
Adds objects/groups to the current list of objects. Objects and groups may be added multiple times. |
 |
Removes objects/groups from the current list of objects. |
 |
Moves the selected object up in the list |
 |
Moves the selected object down in the list |
 |
Sample an object in the model. |
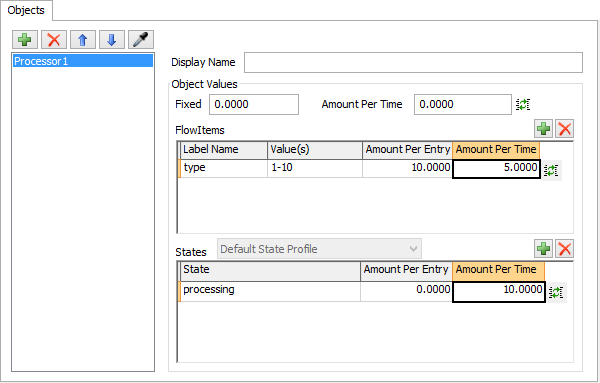
Display Name
Enter text to display on the graph. Leave this field blank to display the object or group name.
Object Values
All object values can be negative or positive numbers. Negative numbers are shown in red and surrounded by parentheses.
Fixed
This value is added once when the model is reset. This value might represent the initial purchase price of a resource.
Amount Per Time
This value is continually added as the model runs. A value of 1.0 would mean at time 50.0 the total time value for the object would be 50.0. Use the Convert Units tool to convert units to model time units.
FlowItems
Use the and
to add or remove items from the table.
Each item has an Label Name, Value(s), Amount Per Entry and Amount Per Time. To apply the
values to all label values, leave the Value(s) field blank. To define multiple label values,
separate numbers using commas and dashes. For example: 1,2,5,10-15,20
- Amount Per Entry value is applied when a FlowItem with the specified label value enters the object.
- Amount Per Time value is applied continually while the flowitem with the specified label value is in the object.
Use the Convert Units tool  to convert units to model time units.
States
Use the and
to add or remove items from the table.
Each item has a State, Amount Per Entry and Amount Per Time.
- Amount Per Entry value is applied when the object enters the specified state. If an object is in the state for 0 time, the fixed value will NOT be applied.
- Amount Per Time value is applied continually while the object is in the specified state.
Use the Convert Units tool to convert units to model time units.
The General Tab
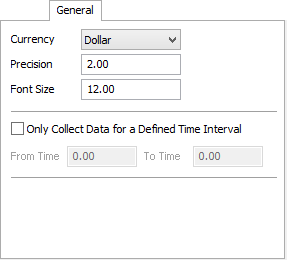
Financial analysis charts have the following general properties:
- Currency - This options changes the prefix of each value to be displayed. The Other option allows you to define a custom string value, or leave the field blank to display no prefix.
- Precision - This defines how many numbers will be displayed right of the decimal point.
- Font Size - This defines the font size of graph text.
- Only Collect Data for a Defined Time Interval - This option creates a time period during which statistics for this graph will be recorded.
- From Time - This defines when statistics will start being recorded.
- To Time - This defines when statistics will no longer be recorded.