Composite Staytime vs Time Template
Overview and Key Concepts

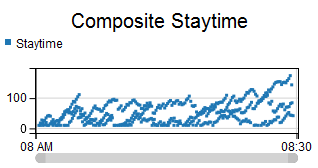
This template creates a time plot. Each point on the plot corresponds with an item exiting the composite object. The horizontal position indicates when the item exited, and the vertical position indicates how long the object had stayed in the composite object.
For more information about composite Staytime templates, see Staytime Templates.
The Options Tab

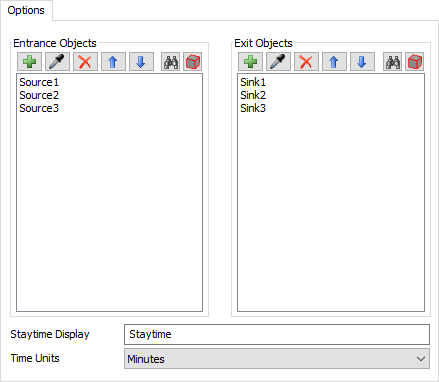
The Options tab has the following properties:
- Entrance Objects - Specifies the objects that define where the composite object begins. See Adding Objects for more information.
- Exit Objects - Specifies the objects that define where the composite object ends. See Adding Objects for more information.
- Staytime Display - Specifies the name of the Staytime data in the legend.
- Time Units - Specifies the time units that should be used on the chart.
The Settings Tab
The Settings tab is identical to the Time Plot Settings tab. For more information, see Time Plot Settings.
The Colors Tab
The Colors tab is identical to the Time Plot Colors tab. For more information, see Time Plot Colors.
The Advanced Tab
This template, like all templates, uses the Advanced Tab. For more information, see Advanced Tab.