Staytime Histogram Template
Overview and Key Concepts

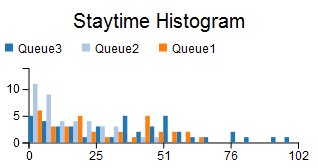
This template creates a histogram. Each bar on the histogram represents a range of staytime values. The height of each bar is determined by the number of staytime values that fit within that range. There is one set of bars per object.
For more information about Staytime templates, see Staytime Templates.
The Options Tab

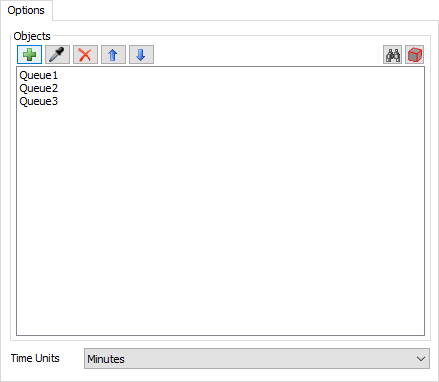
The Options tab has the following properties:
- Objects - Specifies the objects included on the chart. See Adding Objects for more information.
- Time Units - Specifies the time units that should be used on the chart.
The Settings Tab
The Settings tab is identical to the Histogram Settings tab. For more information, see Histogram Settings.
The Colors Tab
The Colors tab is identical to the Histogram Colors tab. For more information, see Histogram Colors.
The Advanced Tab
This template, like all templates, uses the Advanced Tab. For more information, see Advanced Tab.