Empirical Distribution
Overview and Key Concepts
The Empirical Distribution tool is used to generate random values given a table of empirical data:
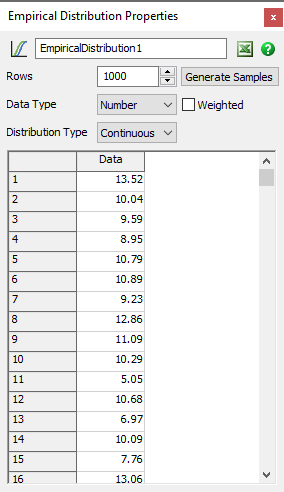
The Empirical Distribution tool provides a table. This table is an input to the tool. The table should contain historical or typical values. You can then treat the Empirical Distribution tool as a random distribution function. It will generate random values based on the input data so that the random values will match the same distribution as the input values.
The Empirical Distribution tool is accessed from the Toolbox.
Data Types
The Empirical Distribution tool supports either Number or String (text) values. If you use text values, the tool will automatically set the Distribution Type to Discrete.
Value Weights
If you check the Weighted box, you'll be able to supply weights for each value. If you don't check the box, all values will be given an identical default weight. n either case, the Empirical Distribution tool sorts the input values and combines duplicate values and their weights.
The end result is that you can increase the likelihood of a value (or, for Continous data, nearby values) by increasing the total weight of a given value. You can increase total weight by specifying weight directly or by adding more instances of the value to the table.
Selecting Distribution Type
You can set the Distribution Type to either Continuous and Discrete.
- Continuous - When set to Continuous, the Empirical Distribution tool assumes the values in the table come from a continuous distribution, such as a process time. When sampleing from the tool, it can return any value between the minimum and maximum values. The tool is unlikely to return any particular input value. However, the distribution of returned values will match the distribution of input values. Using a Continuous distribution is a good choice for process time data.
- Discrete - When set to Discrete, the Empirical Distribution tool assumes that the values in the table form the complete set of possible values. When sampling from the tool, it will return one of the values given in the table. The likelihood of a given value is determined by its frequency or weight in the input data. Using a Discrete distribution is a good choice for discrete values, such as the number of items in an order, or for choosing a random SKU.
Data Input
You can set values in the input table either manually or through the the Excel Interface. Data does not have to be in any order. For more information about importing data from Excel, see the Excel Interface topic.
Visualization
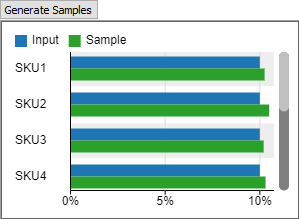
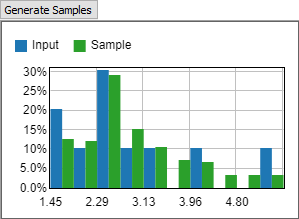
You can use the Generate Samples button to display a chart showing both the input data and sampled random data.
If the distribution is Continuous, a histogram will appear:
If the distribution is discrete, a bar chart will appear: