Task 3. Modeling Available Energy Sources
In this tutorial task, you will model different energy sources and analyze their impact on energy-related costs and carbon emissions.
We will assume the presence of a small on-site photovoltaic system. When its power output is insufficient or unavailable, a normal grid connection will be used.
Step 1 Add a Photovoltaic System
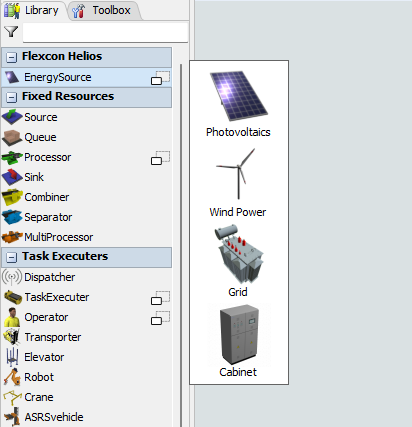
In the 3D model view, find the Flexcon Helios library, click on the EnergySource entry, and drag-and-drop a Photovoltaics object into the model.
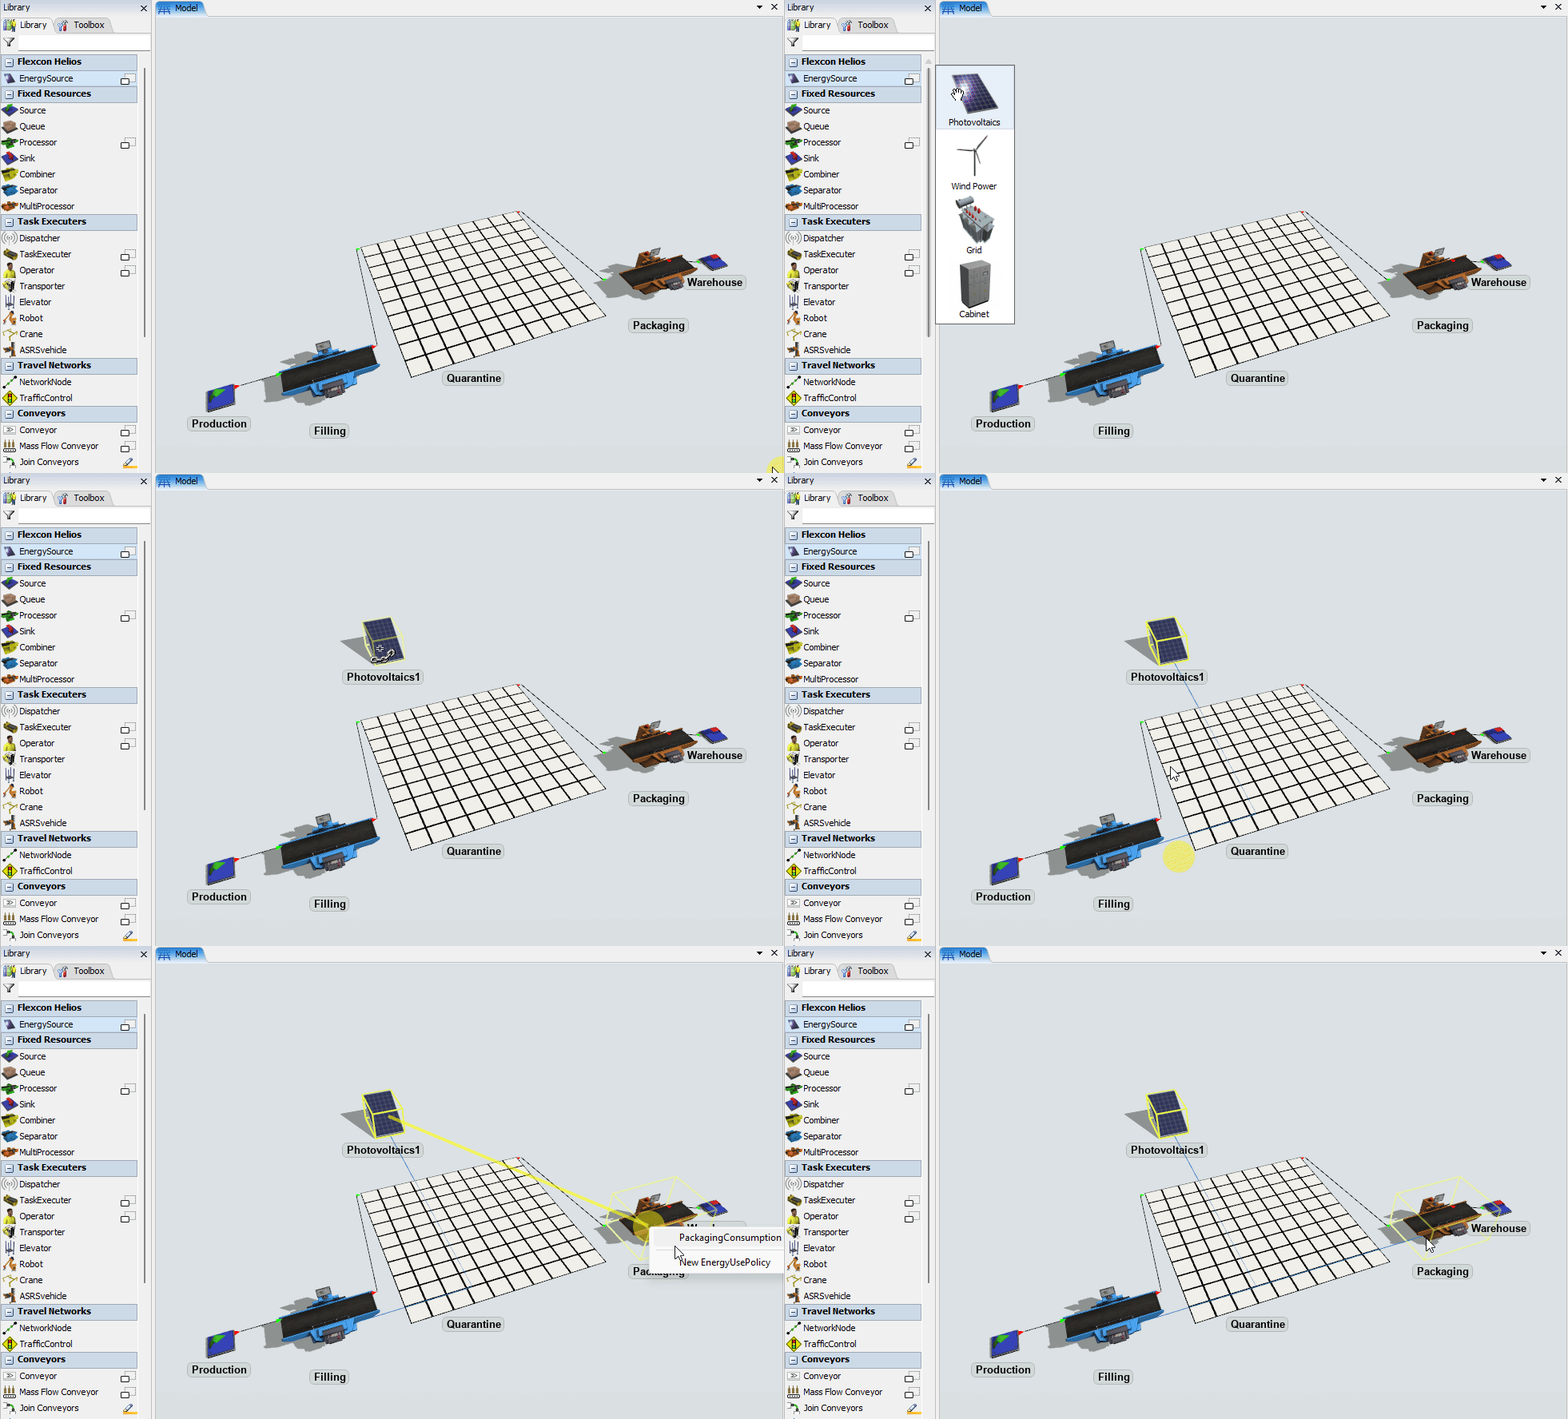
Then, connect this Energy Source to both policies. You can do this in the Energy Sources tab of the EnergyUsePolicy tool, but the quickest way is to A-connect the EnergySource object to a consumer:
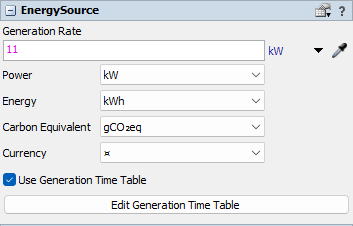
In the Properties of the EnergySource, set its nominal Generation Rate to 11 kW. This is the maximum power that this Energy Source can theoretically provide:
In practice, solar power is a variable energy source and not always dispatchable. In the simulation, you can model this dynamic nature with a Generation Time Table. Press the Edit Generation Time Table button to open its editor.
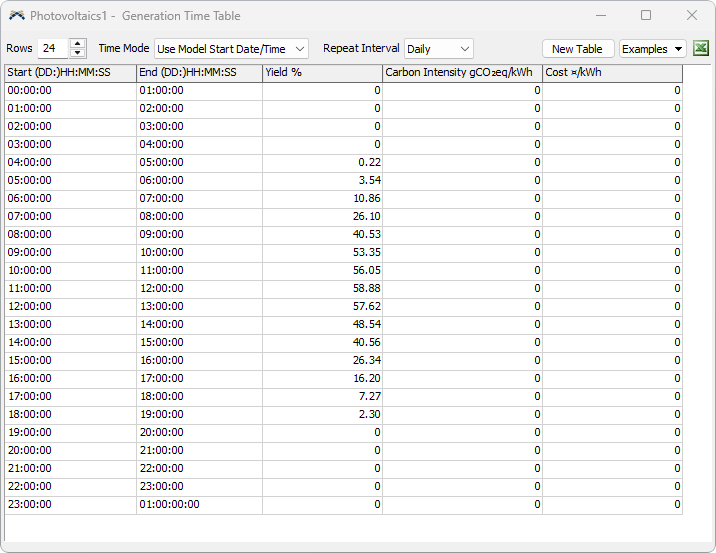
The Yield column represents the percentage of the nominal Generation Rate available for any given period. So, if the Yield % is 50 and the nominal Generation Rate is 11 kW, the actual available power will be 5.5 kW.
Step 2 Add a Grid Connection
Most systems rely on power delivered by an external provider. You can represent this in the model with configurations of the Energy Source object such as Grid or Cabinet, whichever is more thematically appropriate.
In this case, the Energy Source will usually be set up to provide unlimited power. As a simulation object, it can be used to model aggregate costs proportional to energy, indirect carbon emissions, and the availability of grid power where it is a simulation concern.
Drag-and-drop a Grid object into the model and connect it to both Energy Use Policies:
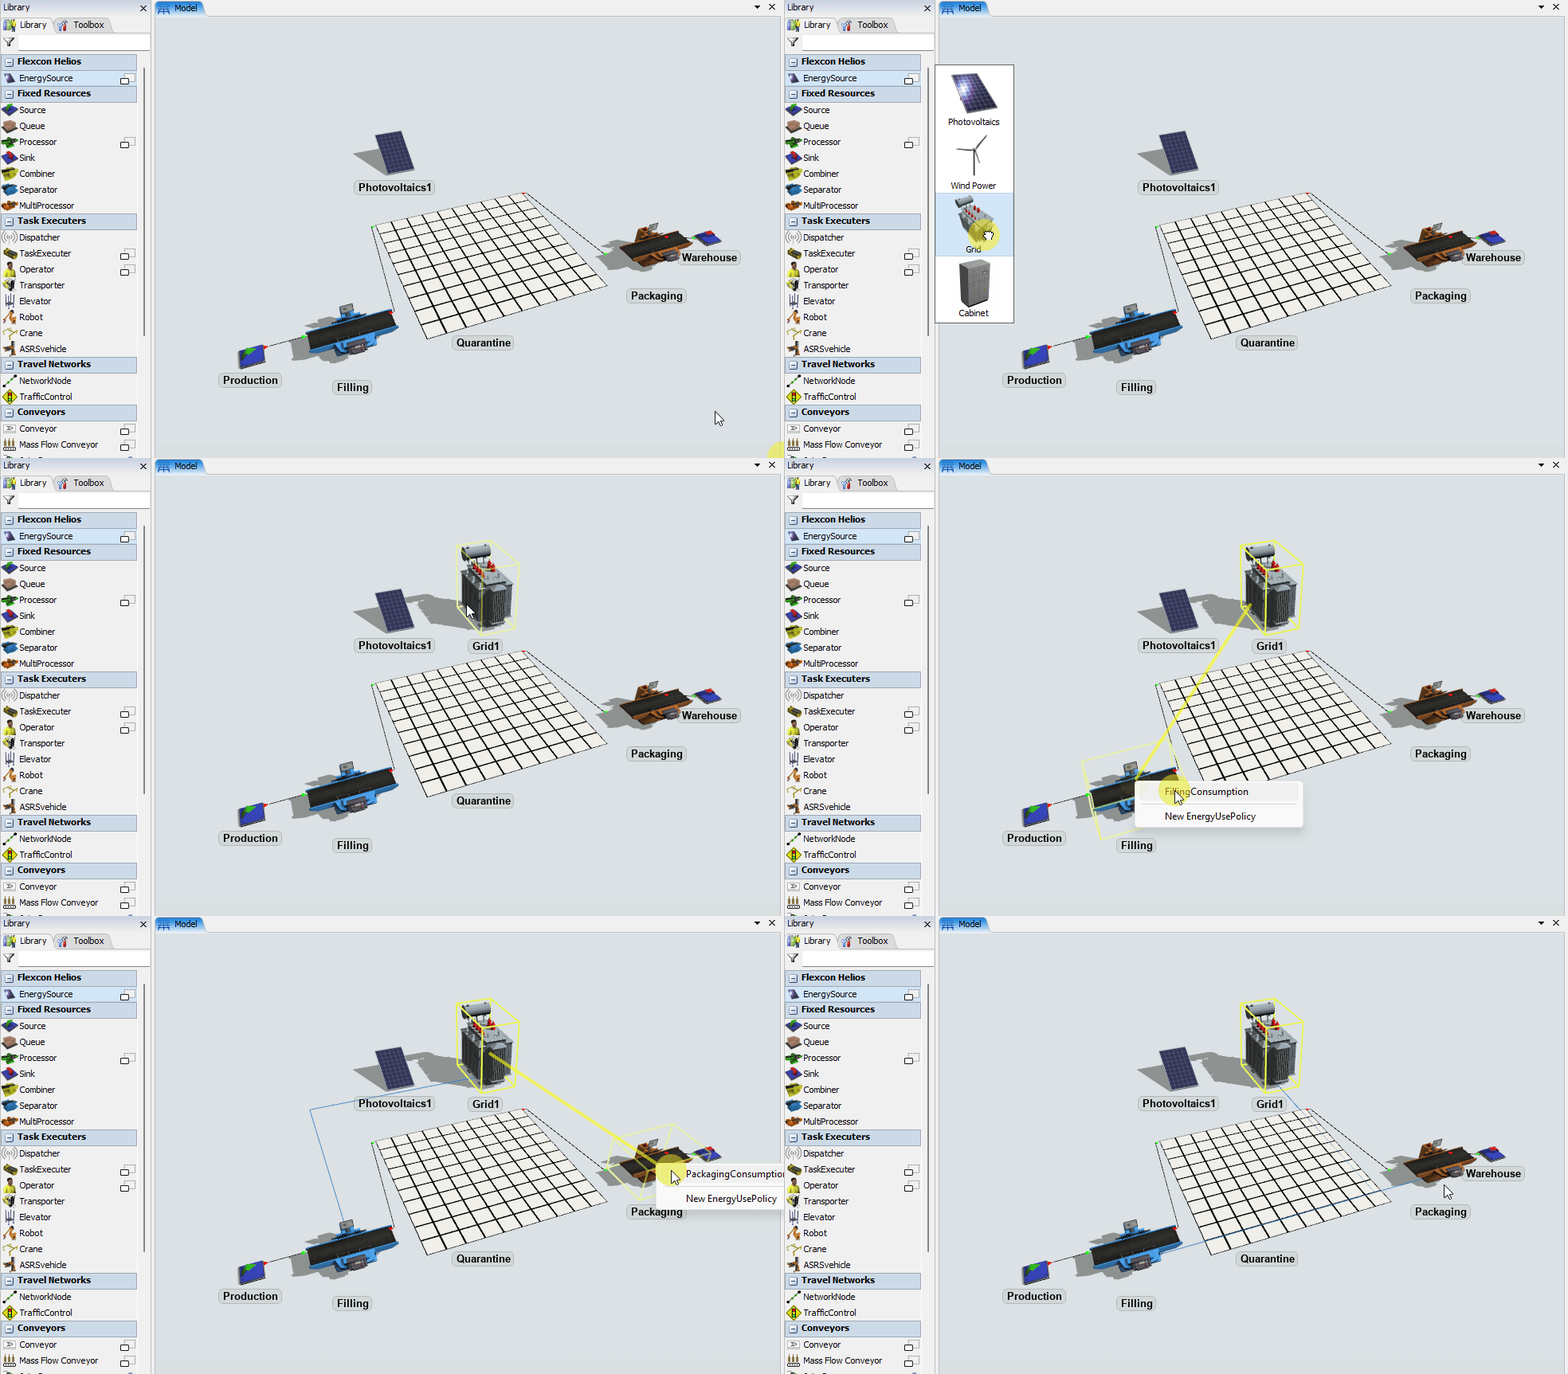
The Grid is already pre-configured with an unlimited generation rate. We will use it to simulate indirect carbon emissions from energy. Carbon intensity is time-, location-, and provider-dependent. In this tutorial, you will use a pre-defined example.
- Press the Edit Generation Time Table button,
- Press the Examples button to access the list of pre-defined configurations,
- Select "Variable carbon intensity: Italy, June 30, 2023".

Step 3 Add Dashboard Charts
To monitor aggregate energy consumption from each of the Energy Sources, add the following chart templates.
To measure the total energy output by each Energy Source, add the Energy Output Bar Chart template:
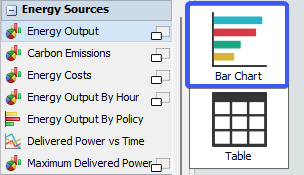
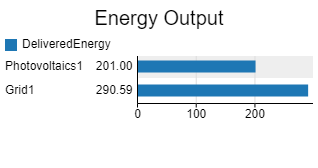
Connect both Energy Sources as chart objects (Energy Source chart templates do not collect statistics from other types of objects). By the end of the 6 simulation days, you should see a chart like this:
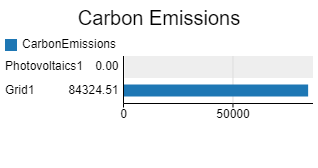
Proceed similarly with the Carbon Emissions Bar Chart. By the end of the 6 simulation days, the chart should look like this:
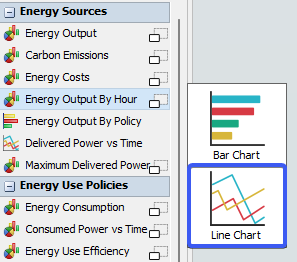
To gain insight into when each Energy Source is used, add either the Energy Output By Hour or Delivered Power vs Time chart templates. The former provides a higher-level overview (total energy consumed per period), while the latter is more detailed and shows every variation of the delivered power. In this tutorial, add a Line Chart for Energy Output By Hour:
By the end of the 6 simulation days, the chart should look like this:
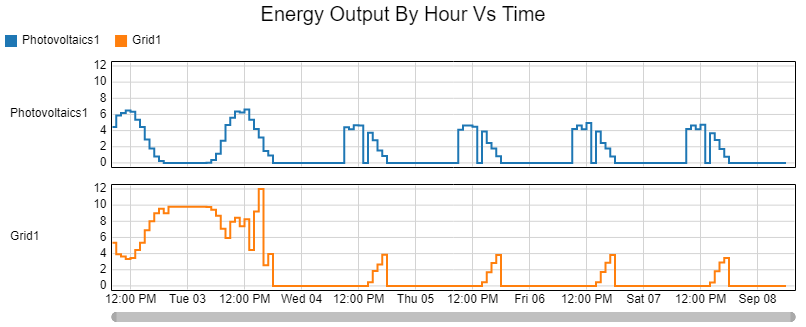
You can observe intensive use of Grid1 power during the first day, corresponding to the night shifts of the Filling line. There are also short bursts of Grid1 power consumption at the end of every day starting from Tuesday, because the production schedule of the Packaging does not align with the solar day.
Conclusion
In the next tutorial task, you will explore What-If scenarios. Continue on to Tutorial Task 4. What-if Scenarios or return back to the Tutorial Overview.