Task 2. Defining Energy Use Policies
In this tutorial task, you will define the power consumption of different parts of the production process.
For simplicity, let's assume that energy is consumed only for Filling and Packaging, and no energy is consumed during scheduled down periods. The numeric values used in this example do not represent an actual production system and are for demonstration purposes only.
The Filling part of the production process consumes at least 0.5 kW for the entire period it is operating (i.e., when it is not scheduled down). It consumes 9.8 kW when actively processing products.
The Packaging part of the production process consumes at least 0.5 kW for the entire period it is operating (i.e., when it is not scheduled down). It consumes 5.0 kW when actively processing products.
Step 1 Define Filling Consumption
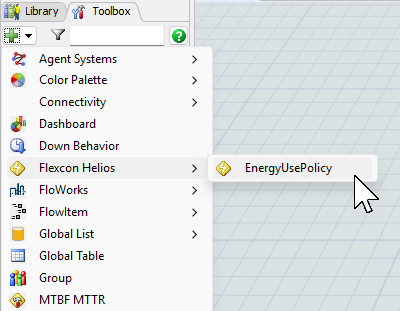
Create a new EnergyUsePolicy tool using the Toolbox menu:
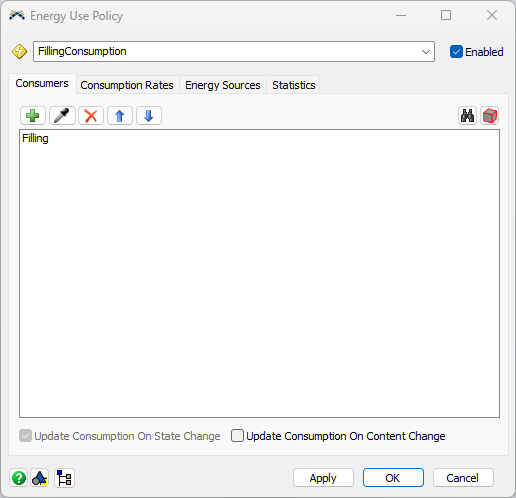
Rename it to "FillingConsumption". In the Consumers tab, add the Filling object:
In the Consumption Rates tab, fill in the power-by-state table of the object as follows:
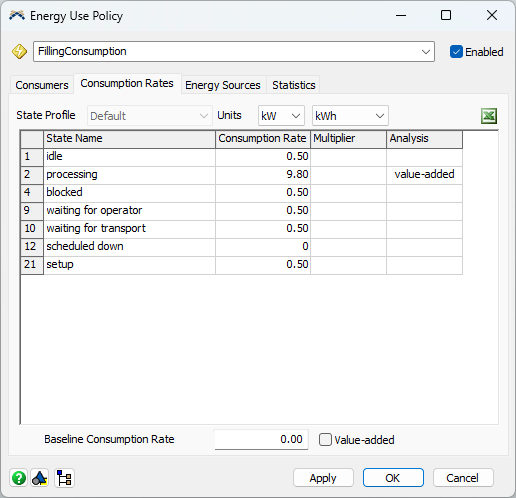
Click once in the Analysis column in the processing row. This indicates that energy used in this state increases the business value of the process.
Note that the scheduled down Consumption Rate and Baseline Consumption Rate are zero.
Step 2 Define Packaging Consumption
Create a new EnergyUsePolicy tool using the Toolbox menu as above.
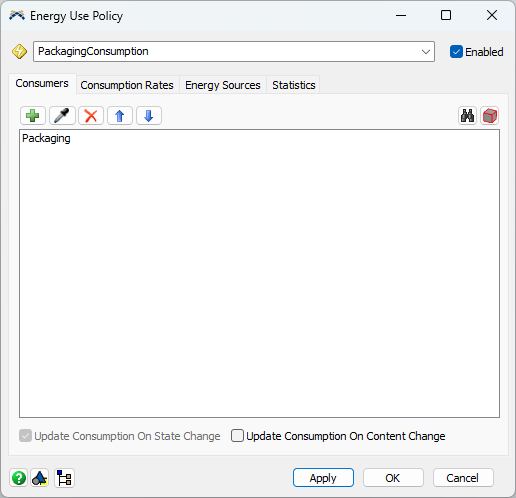
Rename it to "PackagingConsumption". In the Consumers tab, add the Packaging object:
In the Consumption Rates tab, fill in the power-by-state table of the object as follows:
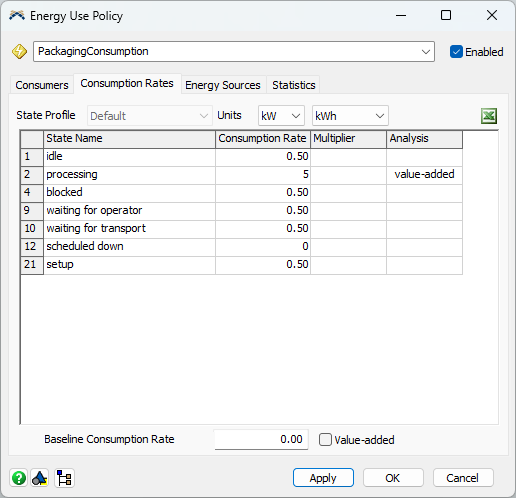
Click once in the Analysis column in the processing row. This indicates that energy used in this state increases the business value of the process.
Step 3 Add Dashboard Charts
If you run the model for six days, you should see non-zero consumption statistics in the Statistics tab of both policies. A better way to present these results is to visualize them with Dashboard Chart Templates.
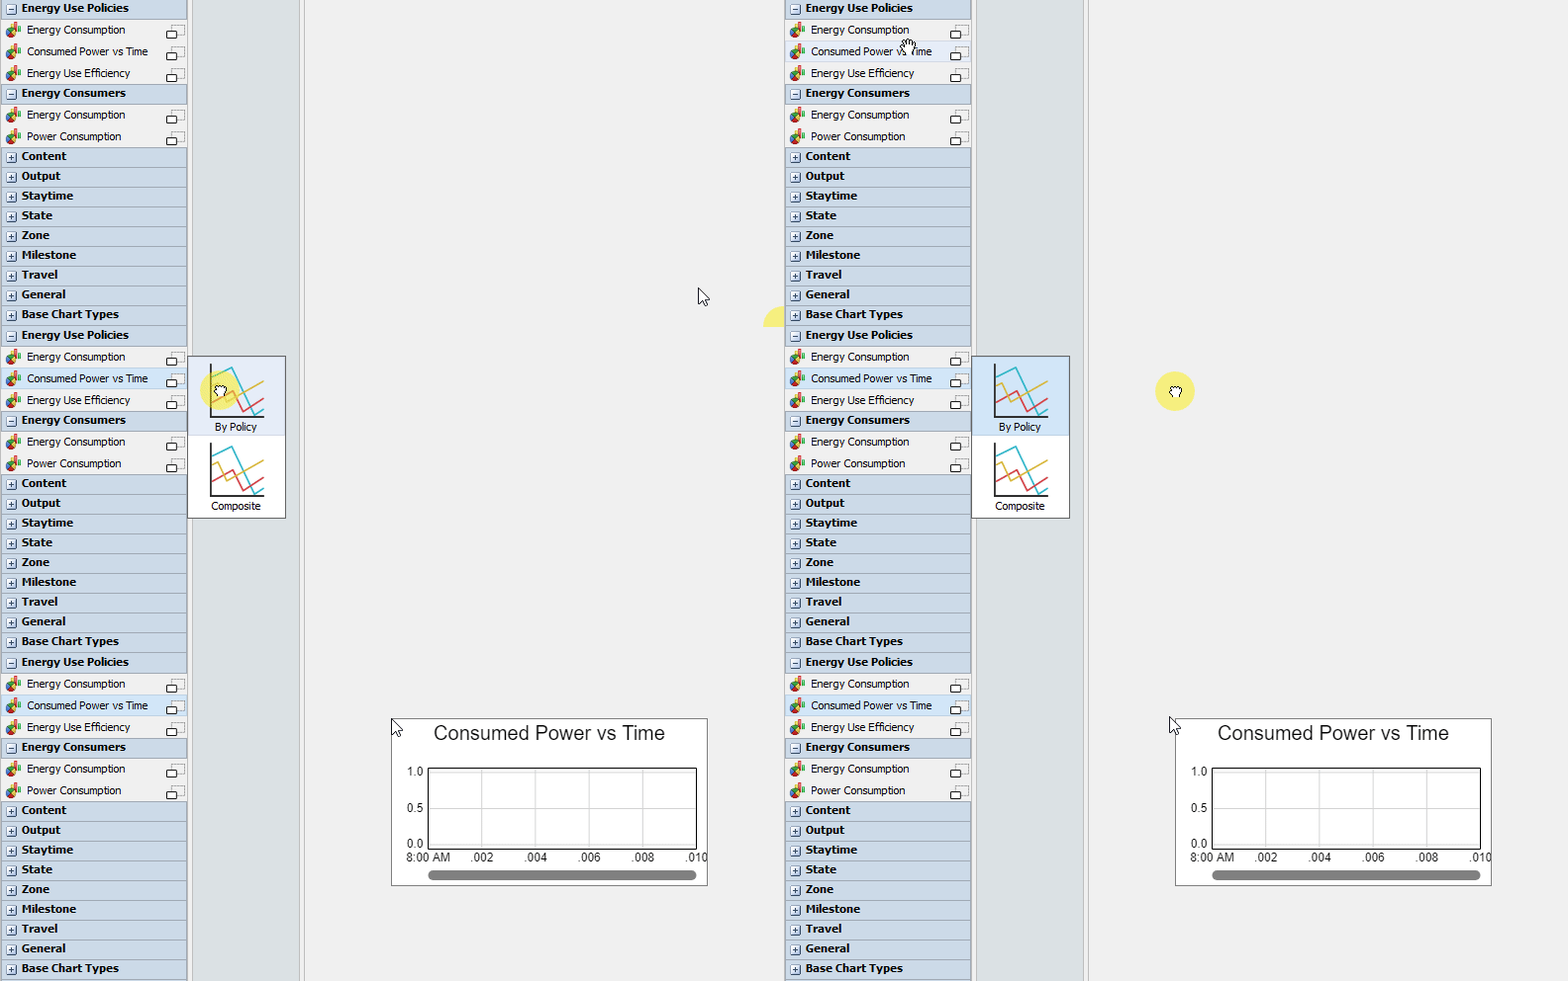
Create a new Dashboard. In the Dashboard Library, find Energy Use Policies, click on the Consumed Power vs Time entry, select By Policy from the pop-out, and drag-and-drop it into the dashboard:
In the Properties of the new chart, add the EnergyUsePolicies objects (Energy Use Policies' chart templates do not collect statistics from other types of objects).
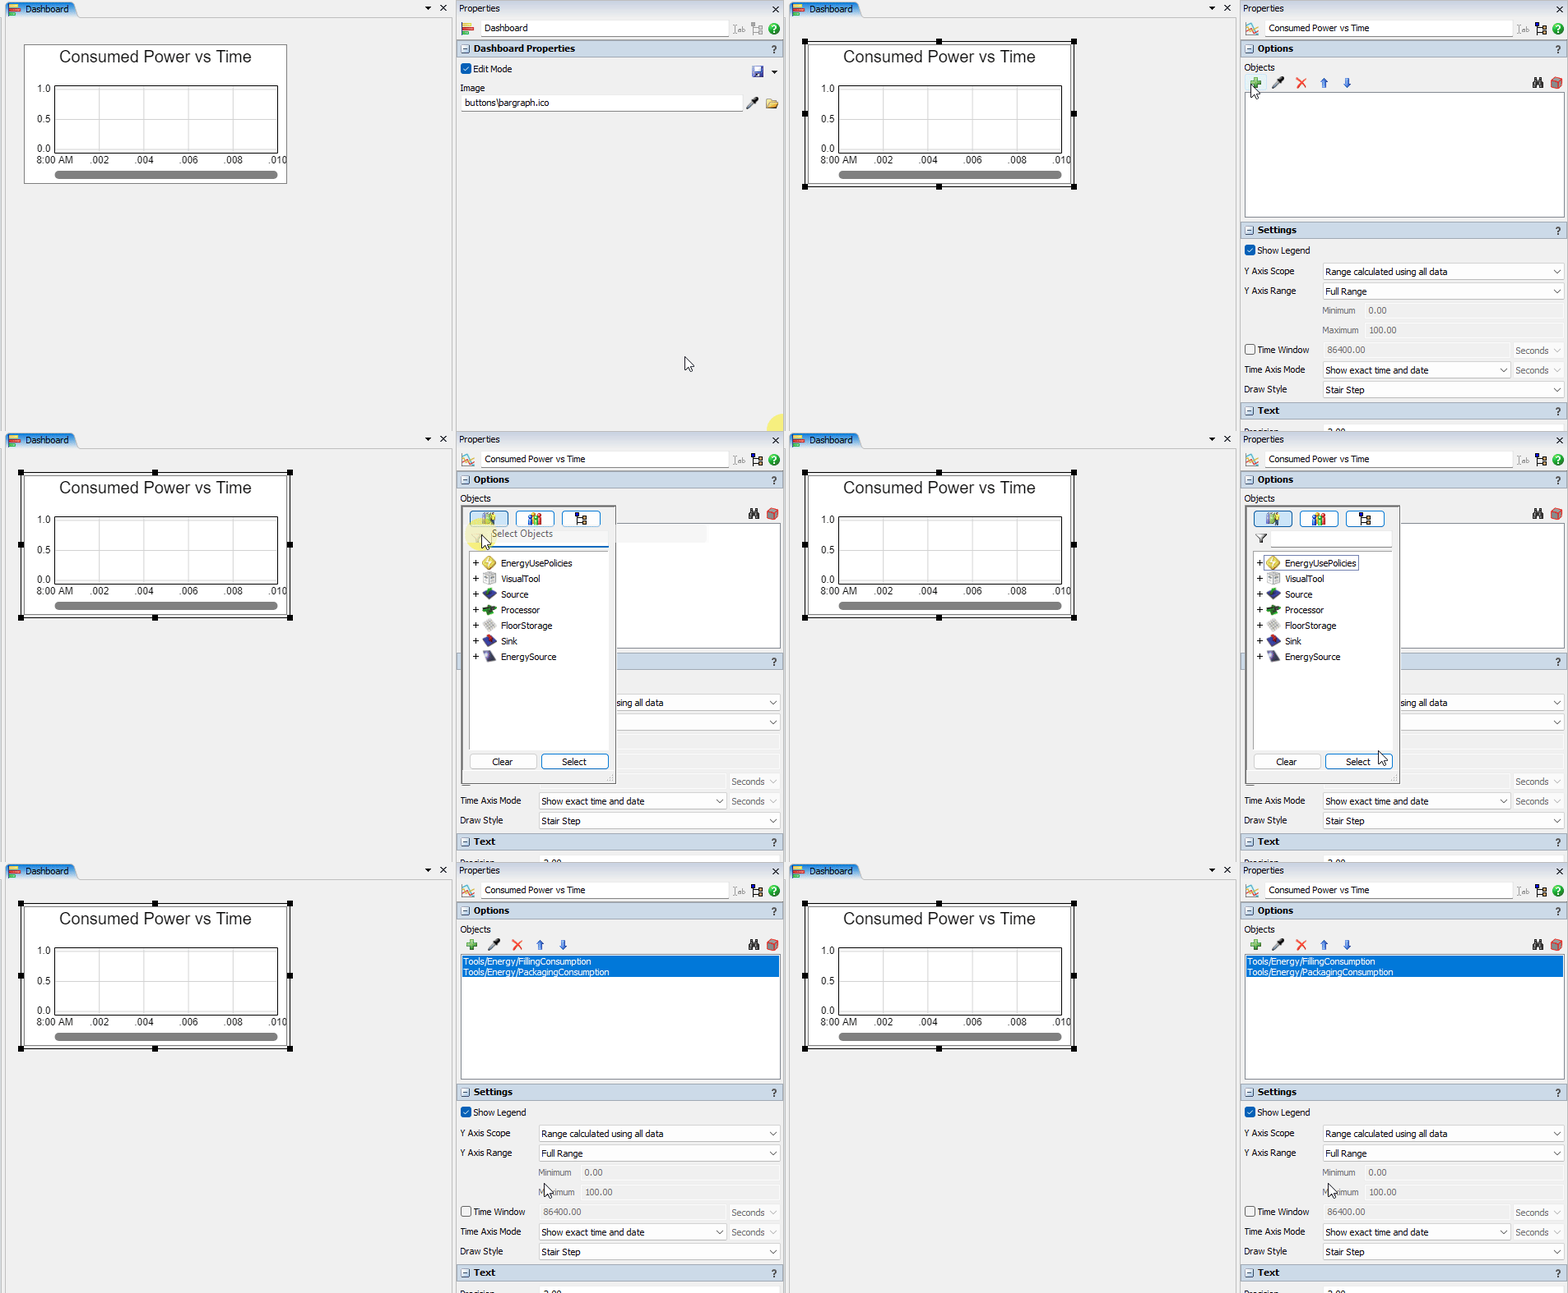
Resize the chart, reset, and run the model. By the end of the 6 simulation days, you will see a chart like this:
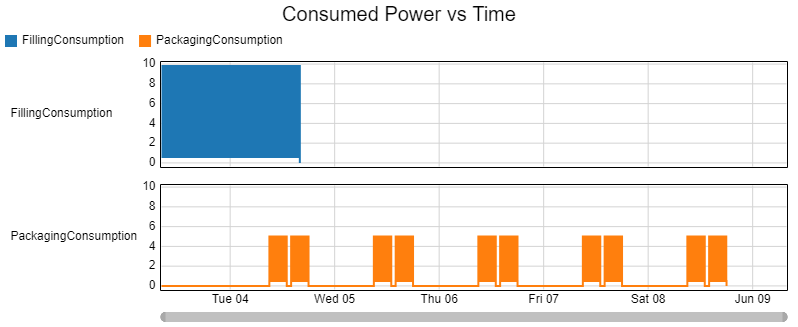
Note that according to the previously configured TimeTables, Packaging does not consume power until the second day, and there is a small overlap between the two policies when both parts of the production process are active.
Use Energy Consumption chart templates to display the total amount of energy used, and Composite Consumed Power vs Time to display a sum of consumed power across several Energy Use Policies.
See Working With Dashboards and Charts for more information on how to use FlexSim dashboards.
Conclusion
In the next tutorial task, you will continue to model available energy sources. Proceed to Tutorial Task 3. Modeling Available Energy Sources or return back to the Tutorial Overview.