Energy Source
Overview and Key Concepts
Energy Source is a 3D object used to model the variable availability of energy, along with its dynamic carbon intensity and costs.
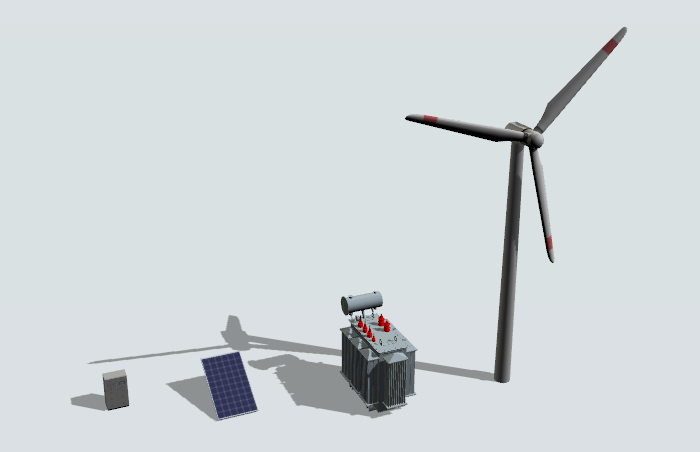
An Energy Source can provide power to one or more connected Energy Use Policies, as long as their total power requirements do not exceed its available power. Whenever available power changes, the Energy Source allows the connected policies to rebalance their load accordingly.
Energy Sources track the following statistics:
- Available power and its change over time
- Current delivered power, total and by Energy Use Policy
- Total delivered energy, total and by Energy Use Policy
- Indirect carbon emissions from energy, both the current rate and the total
- Costs proportional to energy consumption, both the current rate and the total
Energy Sources can represent:
- On-site generation capacity (e.g., solar panels, backup generators)
- Off-site energy suppliers (e.g., utility providers)
- Delivery points or distinct power subsystems within a facility
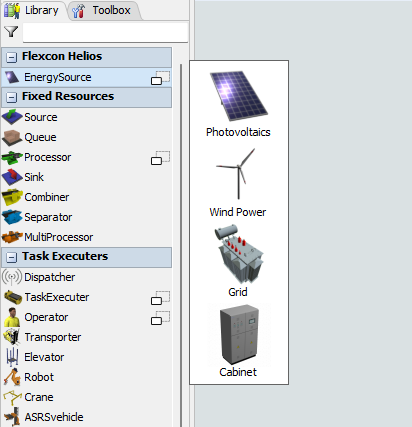
To add a new Energy Source to the model, use the Flexcon Helios 3D view library. The pop-out menu contains different visual representations of the Energy Source, each pre-configured with different default settings:
There are various ways to connect an Energy Source to an Energy Use Policy:
- Add sources in the Energy Sources tab of the Energy Use Policy's tool window.
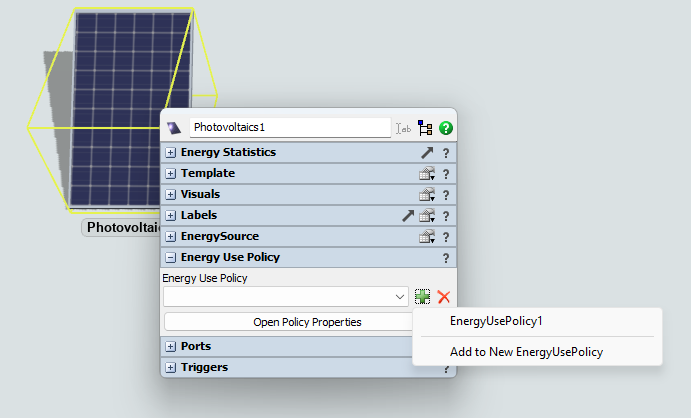
- Use the Add button
 in the
Energy Use Policy panel of the Properties Pane of the Energy Source:
- Connect the Energy Source to a consumer object already connected to an Energy Use Policy.
For an overview of other Flexcon Helios tools, see the Flexcon Helios Overview.
Properties
Energy Source is configured via its Properties and Generation Time Table:
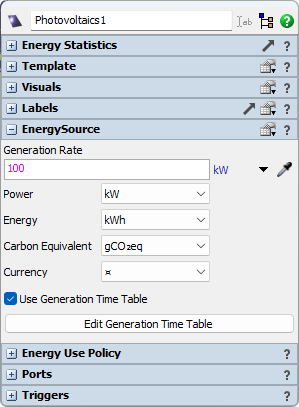
Generation Rate
The nominal (maximum) available power. This value can be defined as a numeric constant or calculated dynamically (e.g., using a statistical distribution). Actual available power is calculated by multiplying Generation Rate and Yield % value in the Generation Time Table. There is a special option Unlimited Power accessible from the pick list.
Generation Rate is re-evaluated at the start of each time interval of the Generation Time Table.
Power
Unit of measurement used for all power quantities (energy per unit of time). Default: kW.
Energy
Unit of measurement used for all energy quantities. Default: kWh.
Carbon Equivalent
Unit of measurement used for carbon emissions (mass). Default: gCO₂eq.
Currency
Unit of measurement used for costs (currency). Default: ¤.
Use Generation Time Table
If active, the availability of the Energy Source, the effective Yield %, Carbon Intensity, and Costs can change over time according to the Generation Time Table. If not active, the Energy Source provides constant available power and does not track costs and indirect emissions.
Press the Edit Generation Time Table button to open the Generation Time Table editor.
Generation Time Table
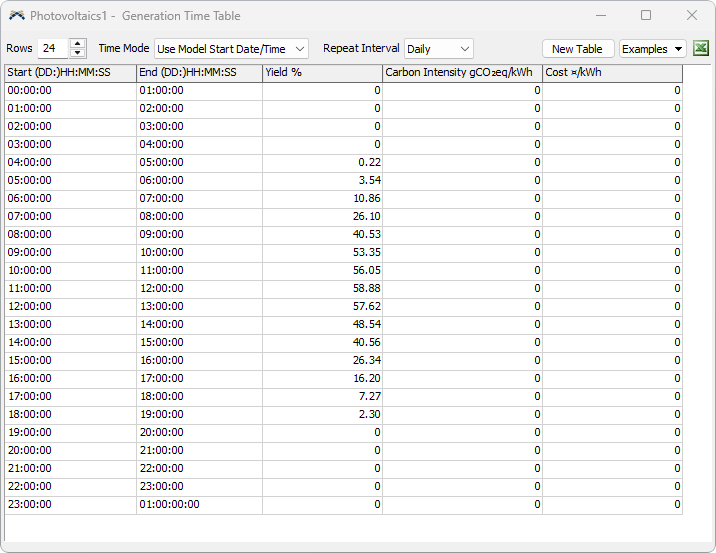
The Generation Time Table defines a schedule of the Energy Source's availability, carbon intensity, and costs. It can be repeated periodically. The entire period is divided into intervals of constant availability, carbon intensity, and costs, which correspond to table rows. The table has the following columns:
- Start: The beginning of a time interval within a period
- End: The end of the time interval
- Yield: The percentage (0-100) of the Generation Rate that is actually available.
Available power is calculated as:
Generation Rate × Yield % / 100
Rows
Append rows to the Generation Time Table or truncate it.
If the end of the Generation Time Table is reached before the end of the Repeat Interval, the Energy Source will reduce available power to zero until the next repeat period.
Time Mode
If set to Use Model Start Date/Time, the time in the Start column is interpreted as the world time of the model (00:00:00 is the midnight of the simulation start date).
If set to From Time 0, the time in the Start column is interpreted as time from the start of the simulation or the start of the last period (00:00:00 is the model start time).
Repeat Interval
Select one of the common repeat periods or Custom.
If the Repeat Interval is set to None, the Energy Source will reduce available power to zero as the simulation reaches the end of the Generation Time Table.
New Table
Initialize a table by selecting a new Repeat Interval and its subdivisions.
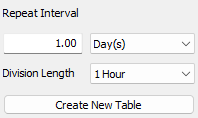
The current Generation Time Table will be overwritten when the Create New Table button is pressed.
Excel Import
| Icon | Description |
|---|---|
 |
This button adds the table as a row in the Excel Importer. |
Statistics
There is an Energy Statistics panel in the Properties Pane of the Energy Source objects. It displays aggregated energy delivery statistics for the entire duration of the simulation.
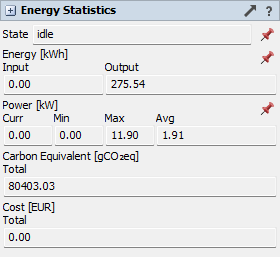
| Icon | Description |
|---|---|
 |
Add a Tracked Variable chart for the corresponding statistics to a dashboard. See also Pinning Statistics to a Dashboard. |
Energy Source automatically converts all quantities to the selected units of measurement.