Composite Staytime Box Plot
Overview and Key Concepts
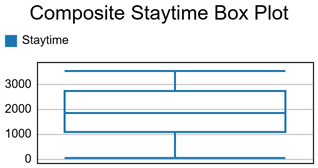
This composite template creates a box plot (also known as a box and whisker plot) for staytime data. Each box plot shows the distribution of staytime values across all objects combined into a single box plot, displaying the minimum, first quartile (Q1), median, third quartile (Q3), and maximum values. The box represents the interquartile range (IQR) between Q1 and Q3, while the whiskers extend to the minimum and maximum values. The median is indicated by a line within the box.
For more information about composite Staytime templates, see Staytime Templates.
Properties Panels
The Composite Staytime Box Plot template uses the following properties panels: